
Bollinger Bands Breakout Signal Indicator
Original price was: $500.00.$180.00Current price is: $180.00.
- Original Indicator
- Trading time: Every time
- Instant Download in Zip file
- Working Timeframe: M1 to W1
- Use on Unlimited Tradingview Accounts
- Type of strategy: Scalping and Intraday
- Source Code:- Pine script
- Works on All pairs Forex, Crypto, Stock Marke etc.
- Customer Support & Free Upgrades
- Lifetime Version
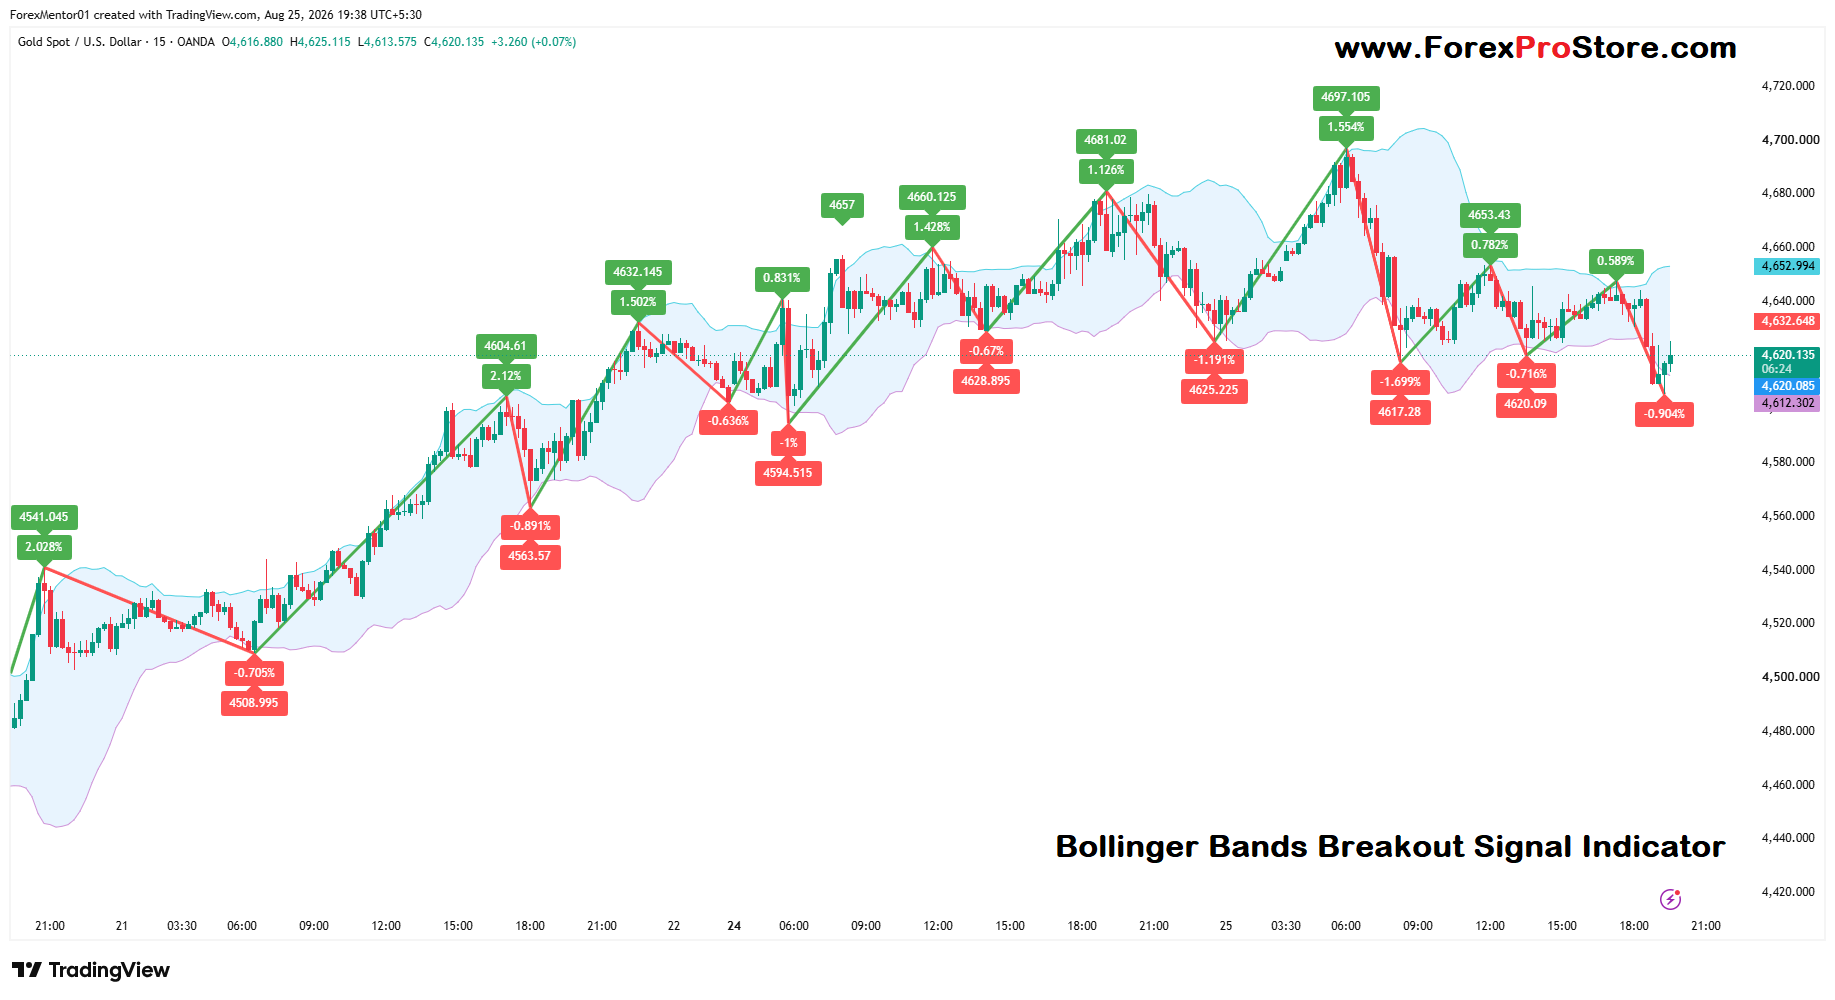
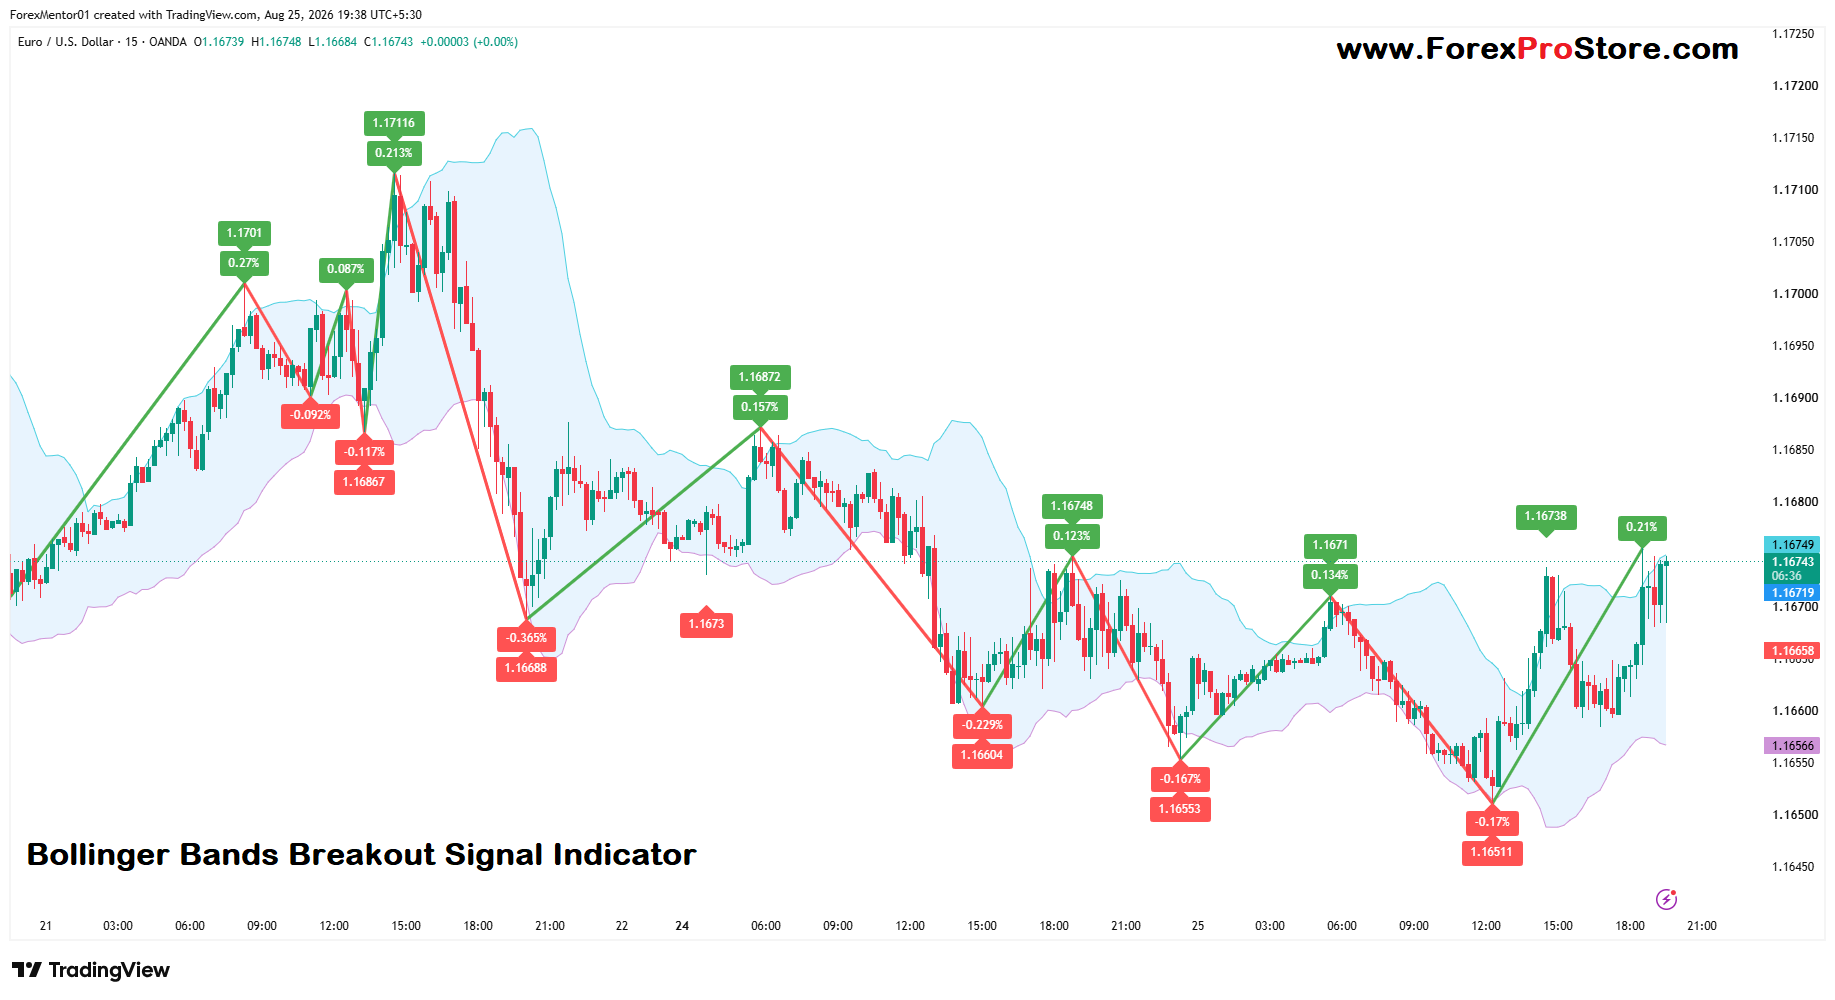
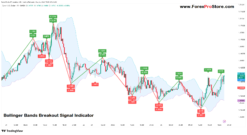
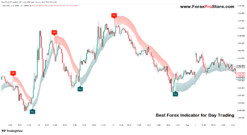
Yes. I’ll explain this exact indicator shown in your screenshot in very simple language.
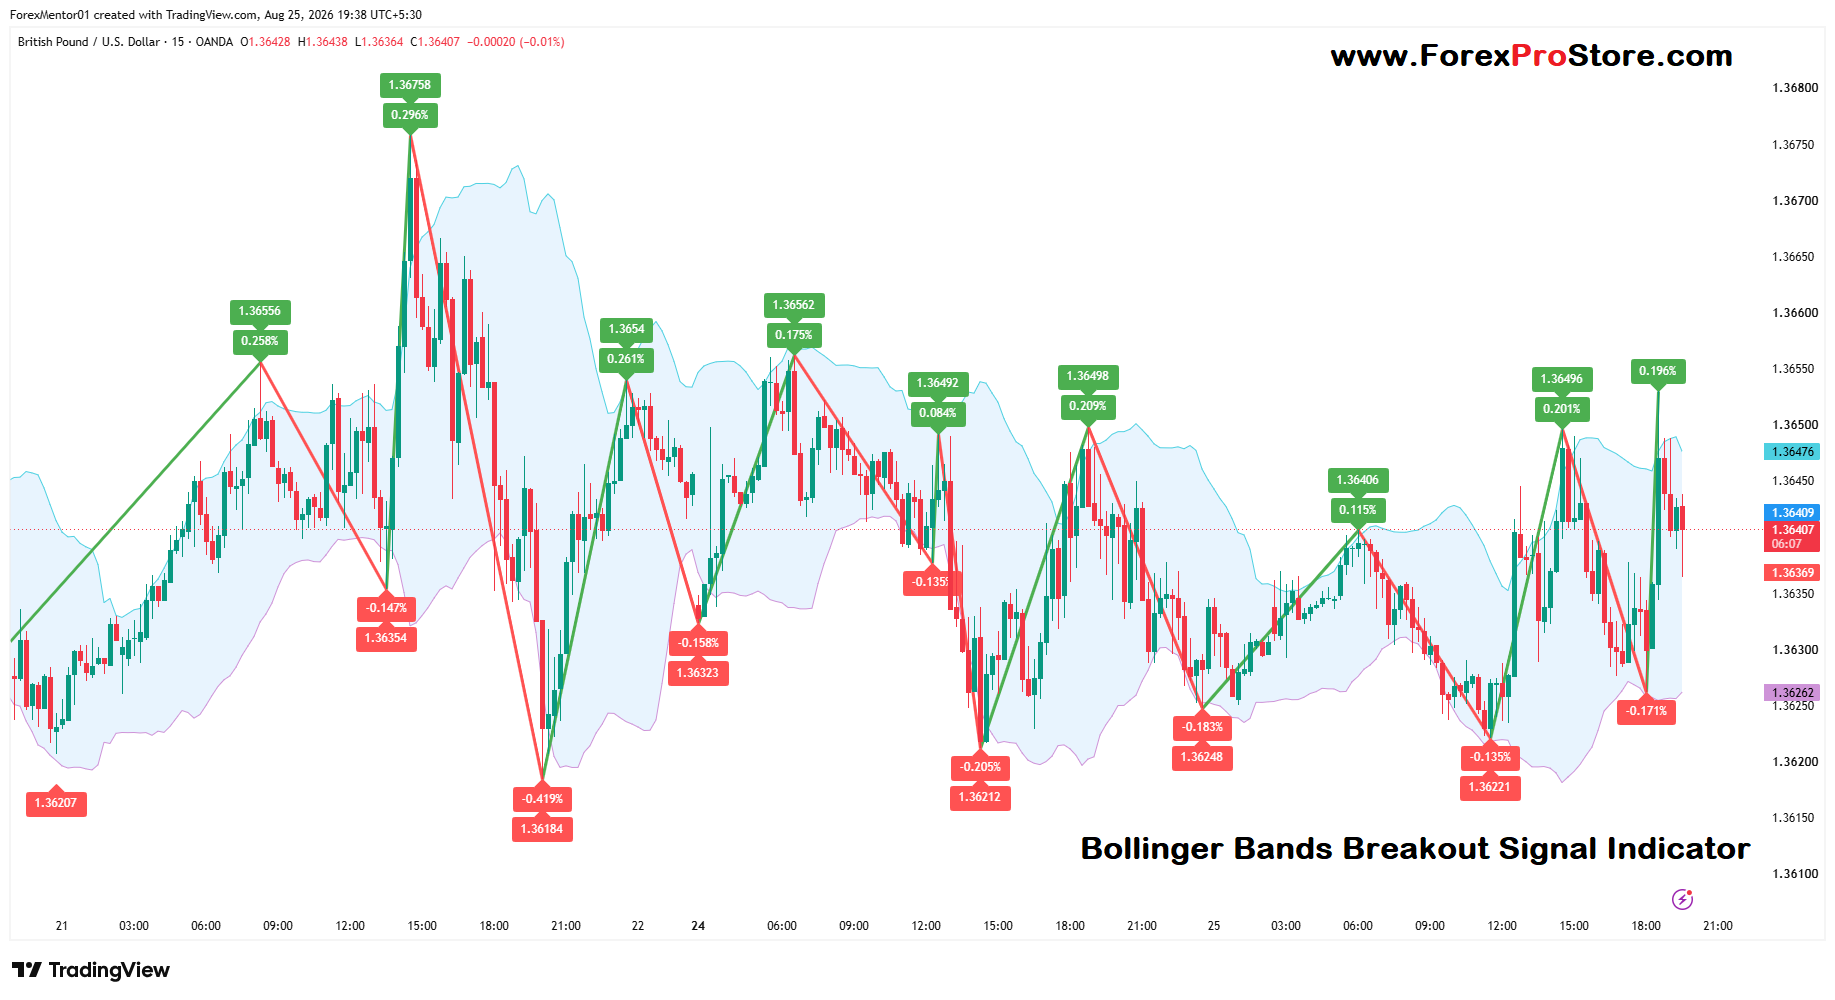
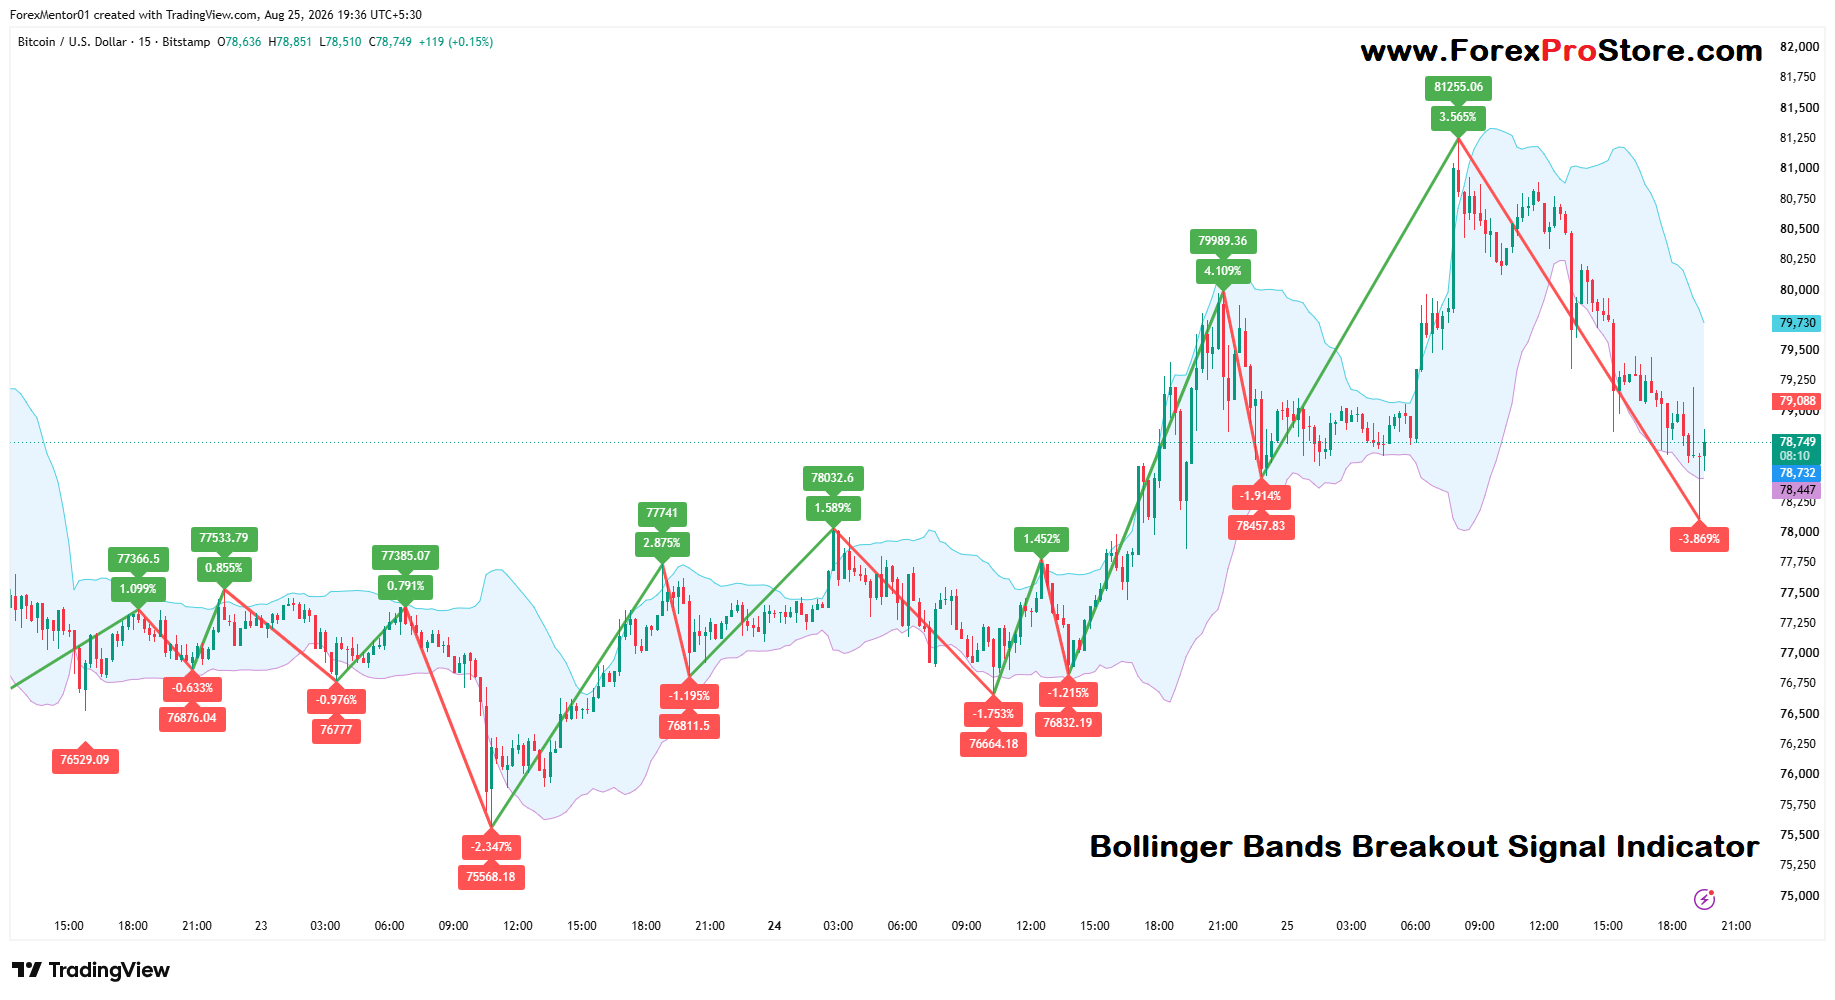
This is a Bollinger Bands Breakout Signal Indicator. It combines Bollinger Bands + price movement/breakout signals + percentage move labels.
1. What you are seeing
There are mainly 3 things on your chart:
🔵 Blue shaded area / blue upper line
→ Bollinger Band area. It shows where price is relatively high/low compared with its recent average.
🟢 Green arrows/lines and green boxes
→ The indicator is highlighting an upward price move.
For example:
- 4594 → 4657
These show that price moved upward from a previous swing low.
🔴 Red arrows/lines and red boxes
→ The indicator is highlighting a downward price move.
For example:
- 4657 → 4563
The percentage shown tells you approximately how large that move was.
2. How to use it for BUY
Don’t simply buy whenever you see green.
A better method is:
🟢 BUY setup
Step 1: Price is near/under the lower Bollinger Band.
Step 2: Price starts moving upward.
Step 3: A green upward signal appears.
Step 4: Wait for the candle to confirm the move.
Step 5: Enter BUY.
Example:
Price falls → touches/approaches lower band → rejection → bullish candle → green signal → BUY.
Stop Loss
Put SL below the recent swing low.
Take Profit
You can target:
- Middle Bollinger Band first
- Previous swing high
- Upper Bollinger Band
3. How to use it for SELL
The opposite.
🔴 SELL setup
Step 1: Price reaches/approaches the upper Bollinger Band.
Step 2: Price starts rejecting the high.
Step 3: A red downward signal appears.
Step 4: Wait for candle confirmation.
Step 5: Enter SELL.
Example:
Price rises → reaches upper band → rejection → bearish candle → red signal → SELL.
Stop Loss
Put SL above the recent swing high.
Take Profit
You can target:
- Middle Bollinger Band
- Previous swing low
- Lower Bollinger Band
4. What do the percentages mean?
This is one of the useful parts of your indicator.
For example, your chart shows:
🟢 +1.554%
That means the highlighted upward move was approximately 1.554%.
And:
🔴 -1.699%
means the highlighted downward move was approximately 1.699%.
So you can quickly see whether a move was small or significant.
Simple interpretation
| Signal | Meaning |
|---|---|
| 🟢 Green | Upward move |
| 🔴 Red | Downward move |
| +0.5% | Small/moderate bullish move |
| +1.5% | Stronger bullish move |
| -0.5% | Small/moderate bearish move |
| -1.5% | Stronger bearish move |
Don’t treat the percentage itself as a guaranteed future target. It describes the move the indicator has identified.
5. The most important thing: Don’t enter immediately
This is where many traders make mistakes.
Suppose you see:
🟢 BUY signal
Don’t immediately click BUY.
Instead ask:
1. Is the overall trend bullish?
2. Is price above or below the Bollinger middle line?
3. Is there a strong bullish candle?
4. Is there nearby resistance?
5. Is the risk/reward reasonable?
If several things agree → the setup is stronger.
6. Very simple strategy for XAUUSD 15-minute
Your screenshot is Gold / XAUUSD on 15-minute.
You can use this basic approach:
🟢 BUY
Green signal + price above Bollinger middle area + bullish candle confirmation
→ BUY
SL → below recent swing low
TP → previous high / upper Bollinger Band
🔴 SELL
Red signal + price below Bollinger middle area + bearish candle confirmation
→ SELL
SL → above recent swing high
TP → previous low / lower Bollinger Band
7. Best use of this indicator
I would use it primarily as a trend + swing confirmation tool, rather than as a “green = buy / red = sell” automatic system.
Strong BUY
🟢 Green signal
+
Price above middle BB
+
Higher highs / higher lows
+
Bullish candle confirmation
= Better BUY setup
Strong SELL
🔴 Red signal
+
Price below middle BB
+
Lower highs / lower lows
+
Bearish candle confirmation
= Better SELL setup
8. What are the benefits?
✅ 1. Easy to understand
The green/red markings make major price movements visually obvious.
✅ 2. Helps identify swings
You can quickly see where significant highs and lows occurred.
✅ 3. Shows movement percentage
You can immediately see whether a move was 0.5%, 1%, 2%, etc.
✅ 4. Helps with trend direction
The sequence of green and red movements can help you understand whether the market is generally moving up or down.
✅ 5. Bollinger Bands show volatility
When the bands expand, volatility is increasing.
When they become narrow, the market is becoming quieter and a larger move may eventually occur.
✅ 6. Useful for finding pullbacks
In an uptrend, you can wait for price to pull back toward the Bollinger area and then look for bullish confirmation.
Our Payment Options:👇
1) Bitcoin Wallet:
14vtHib35eUirhcXiKRUqUs7Ejcy51gFNu
2) USDT(Tether) Wallet: (ERC20)
0x254b7bdbea655bfaf428ffd8010945b04a369114
3) TRX(Tron) Wallet: (TRC20)
TJPTi6GtfAs2P2mJaAYsR4LhdKpvsa5KE3
4) XRP(Ripple): Tag(370508805)
rNxp4h8apvRis6mJf9Sh8C6iRxfrDWN7AV
And another crypto wallet: on request
5) Visa/Master Card Via Payment Link: On Request
6) Paypal: On Request
7) Skrill: On Request
8) Neteller: On Request
9) Western Union: On Request
10) This Website(www.secretofforex.com). You can purchase directly from website by Your Credit/Debit Cards and All crypto currencies and Instant Download Indicator Files.
Send payment screenshot to: 👇🏿
Payment After we will provide product within 90 minutes.
If you want any proofs of Indicator or have any questions then feel free to message
WhatsApp: Click Here
Telegram: Click Here
Mail Us: Click Here
Thank You ❤️
Related products
TradingView Indicators
TradingView Indicators