
Best Forex Indicator for Day Trading
Original price was: $600.00.$250.00Current price is: $250.00.
⭐ Indicator Features
- ✅ Original & Reliable Indicator
- ⏰ 24/7 Trading — Use Anytime
- ⚡ Instant ZIP Download
- ⏱️ Timeframes: M1 to W1
- 💻 Works on Mobile, Tablet & PC
- ♾️ Unlimited TradingView Accounts
- 📊 Scalping & Intraday Strategy
- 📝 Pine Script Source Code Included
- 🌍 Works on Forex, Crypto & Stocks
- 🛠️ Customer Support & Free Updates
- 💎 One-Time Payment • Lifetime Use
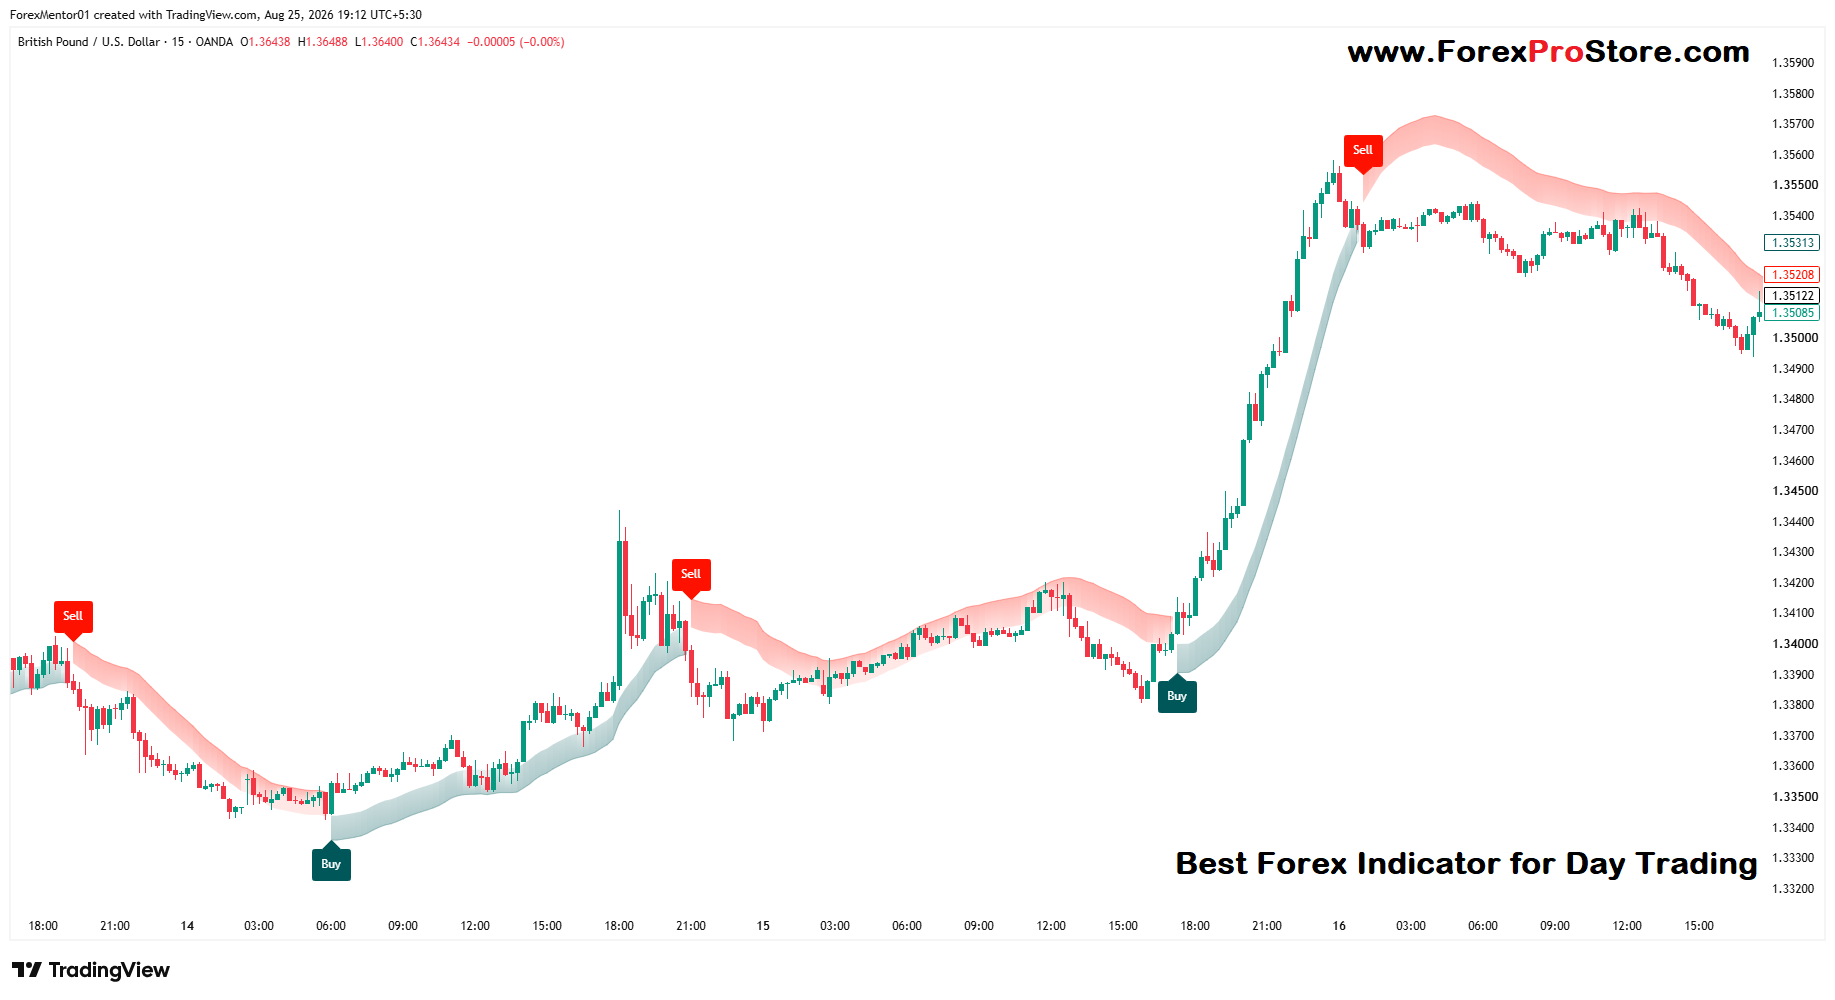
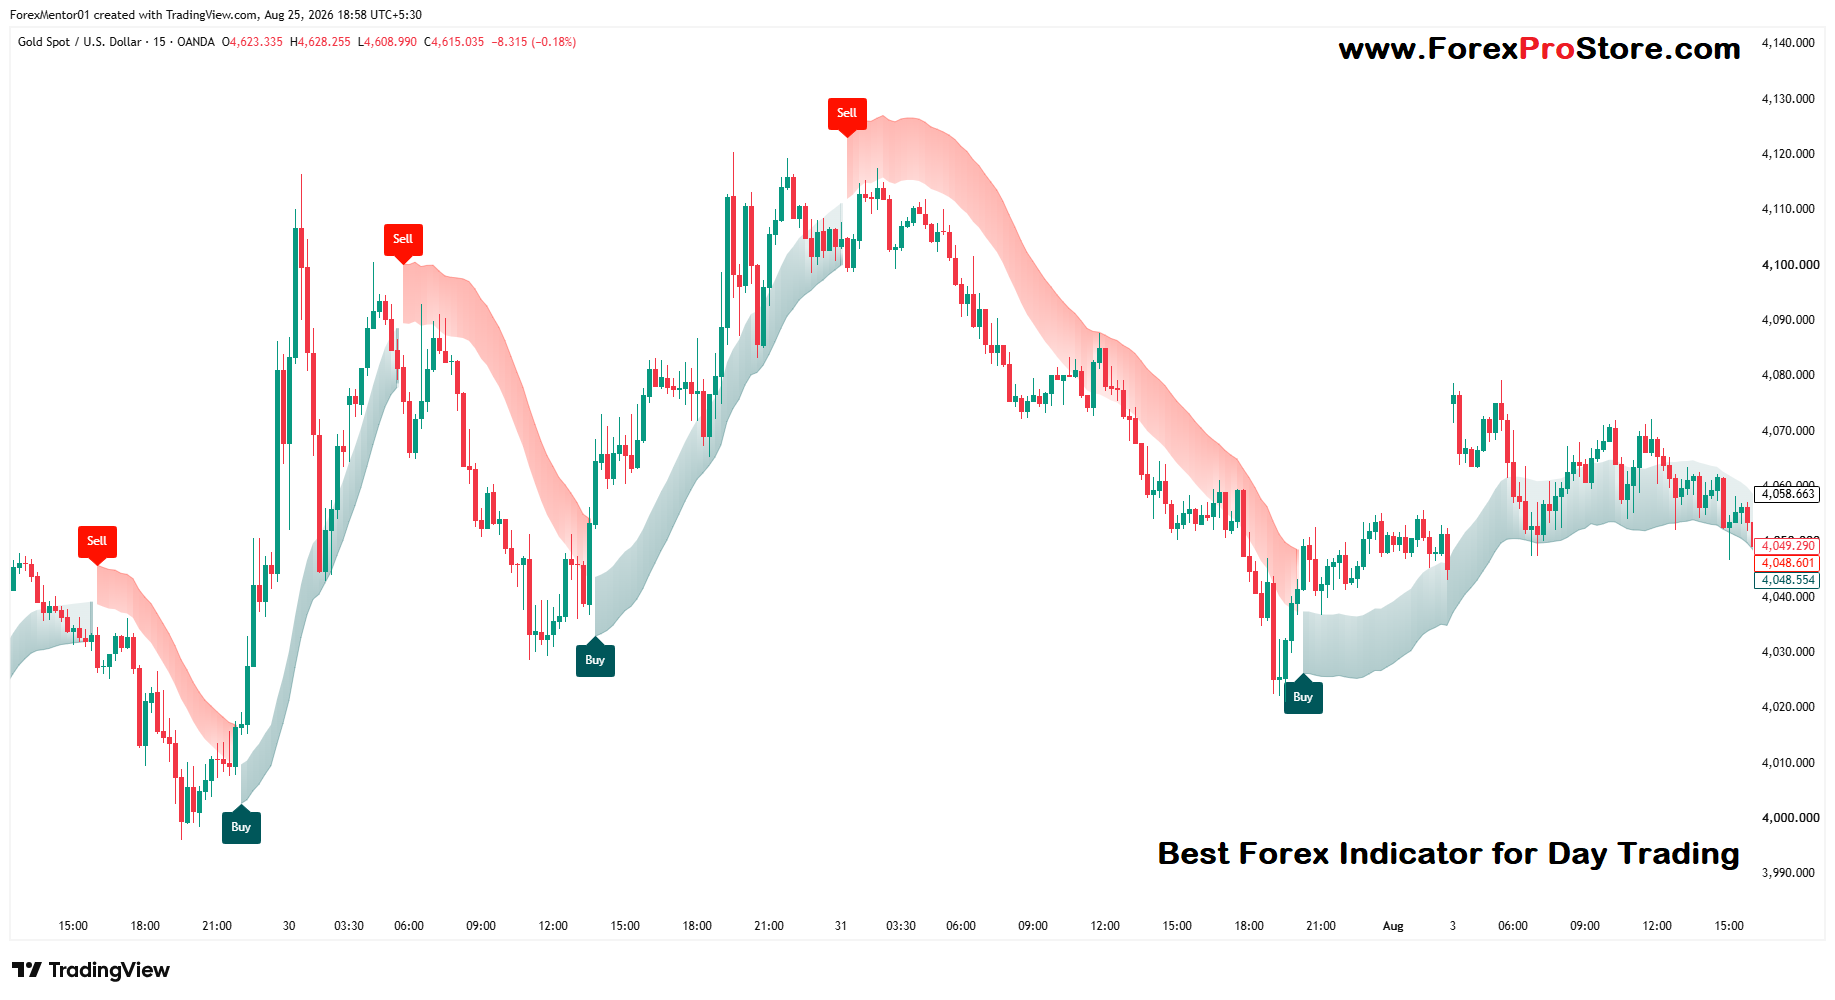
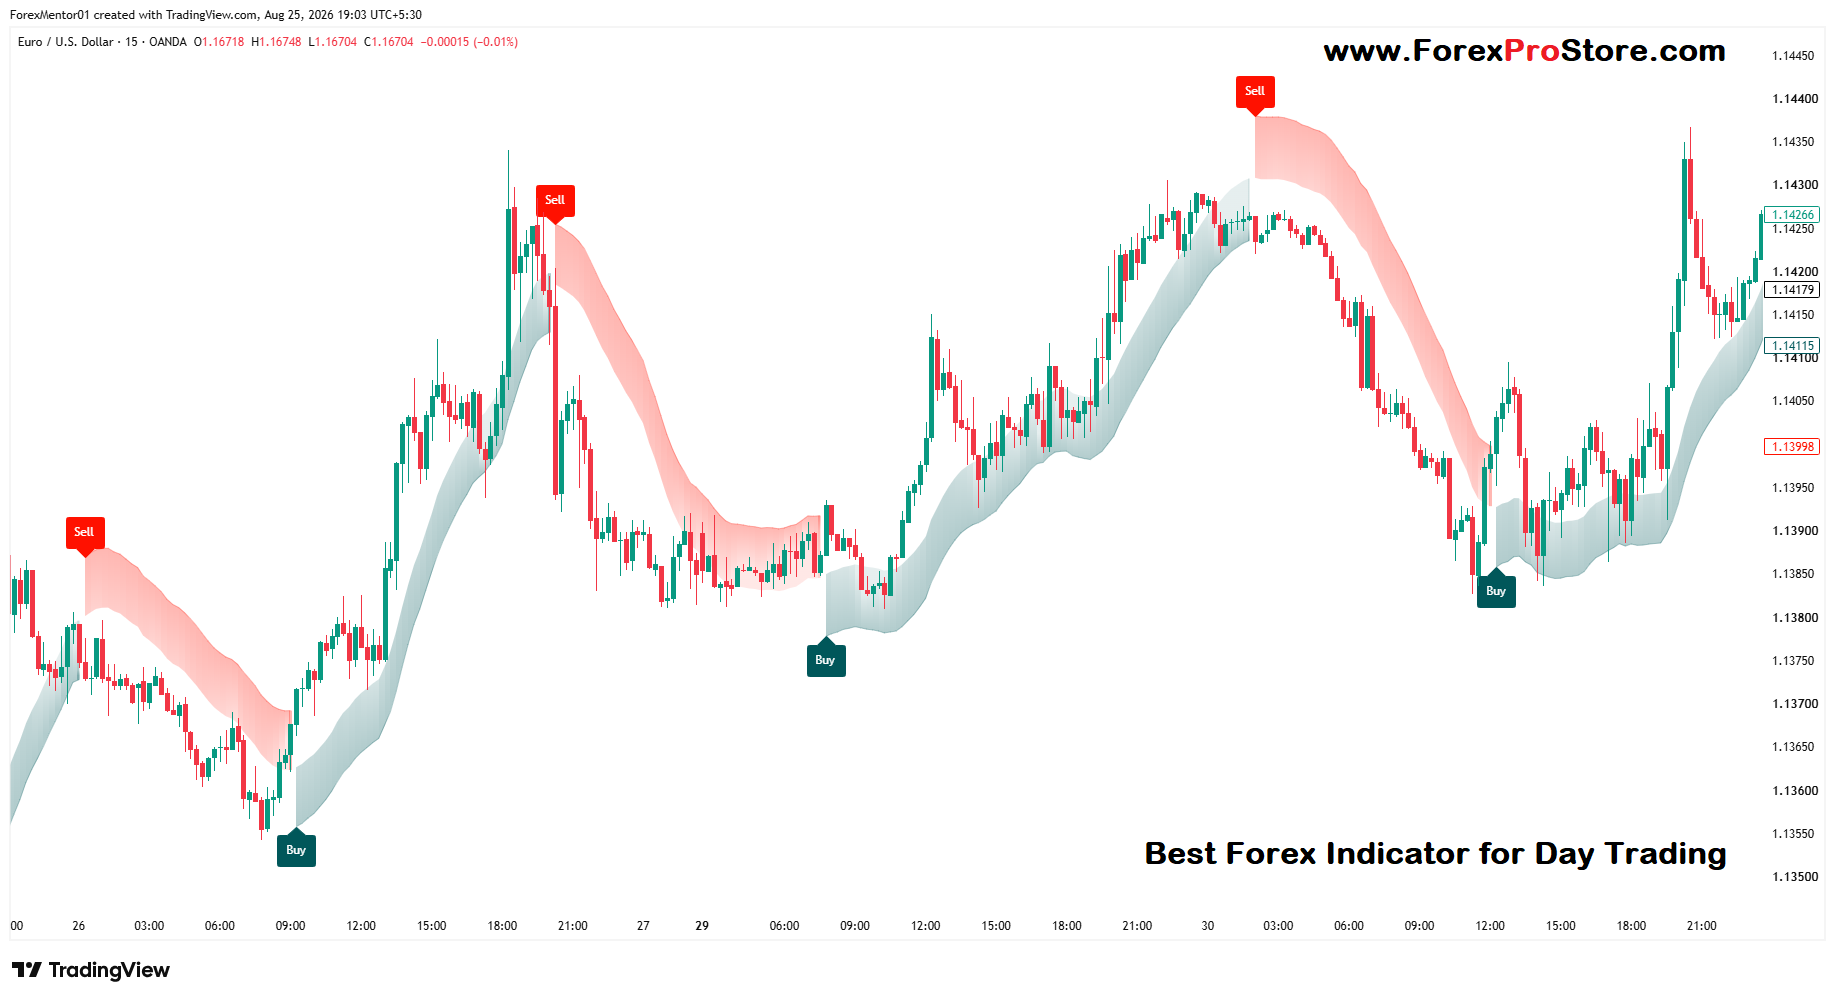
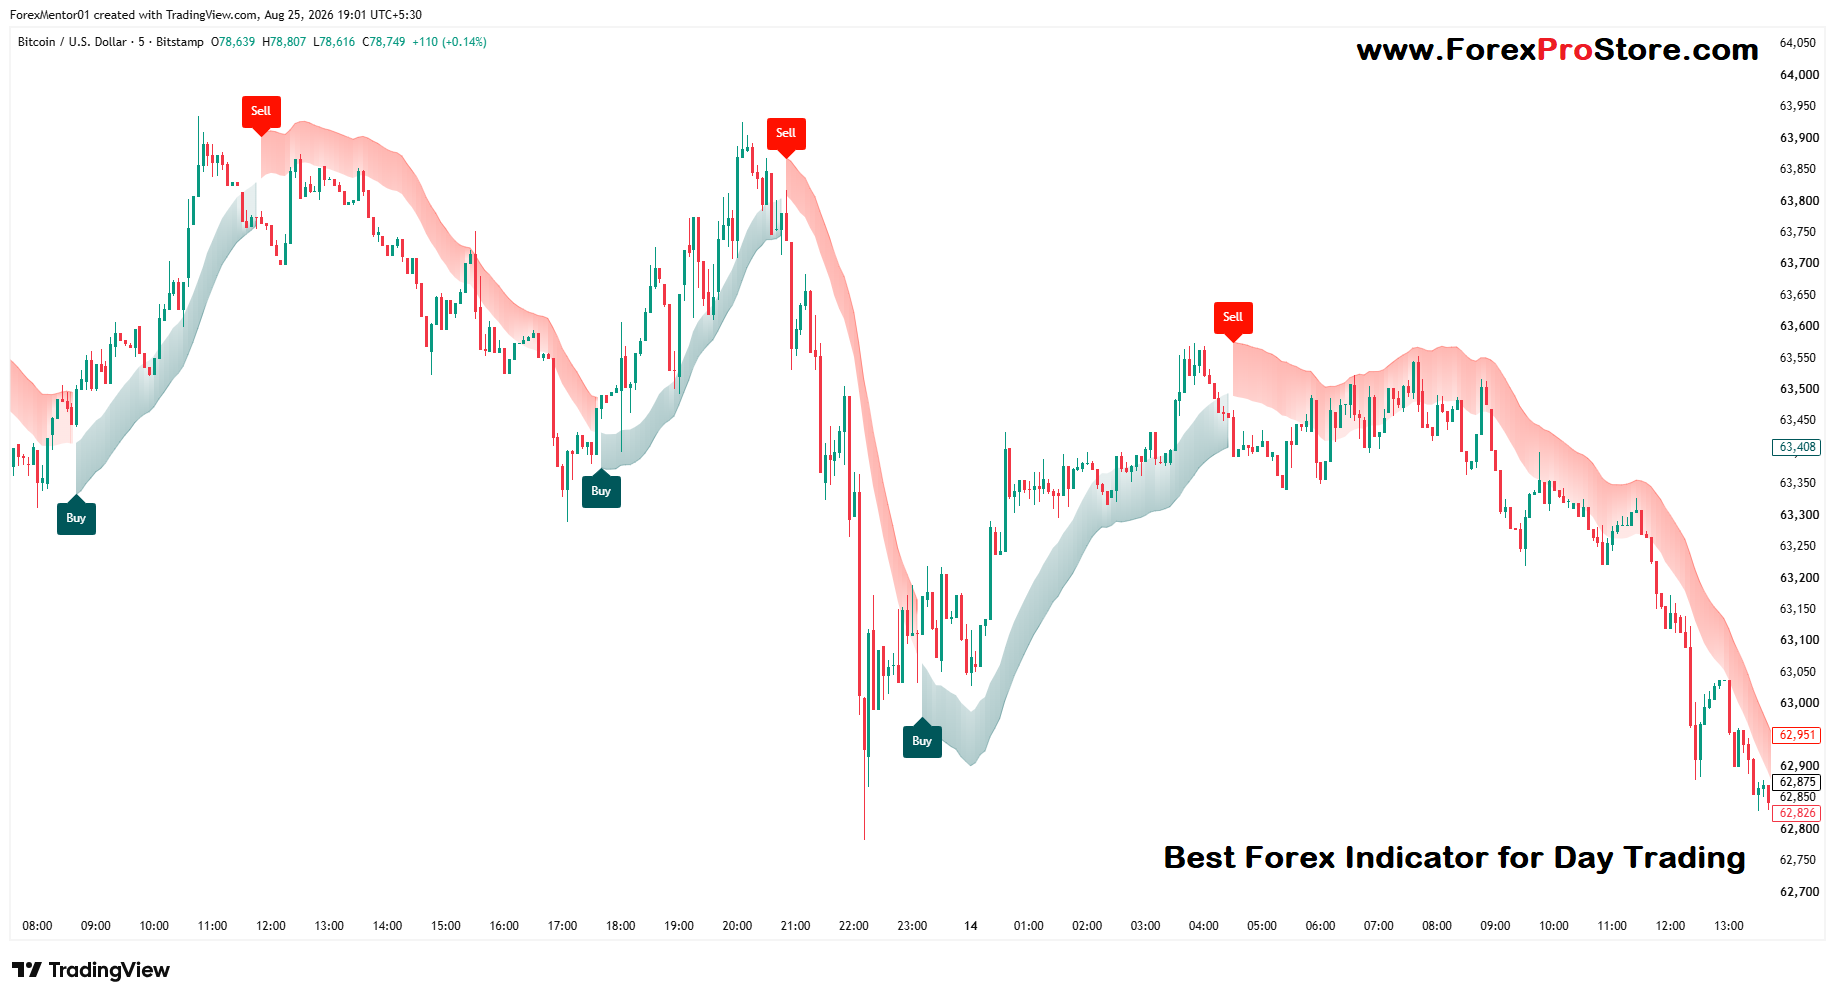
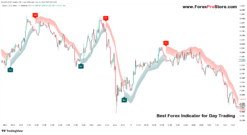
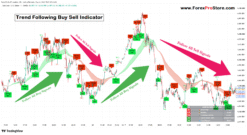
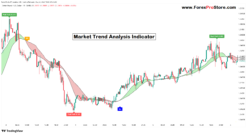
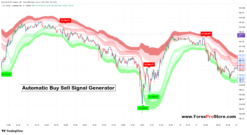
Yes. I can explain this indicator from the chart. One important point: the screenshot appears to show a custom TradingView indicator, The green/blue band appears below price during bullish movement, while the red/pink band appears above price during bearish movement. The Buy/Sell labels are the indicator’s directional signals.
From the chart, it appears to combine a trend cloud/band + Buy/Sell signals. This is conceptually similar to ATR-based trend indicators such as Supertrend, where volatility is used to keep a dynamic trend line around price. (TradingView)
1. What you are seeing
In your screenshot:
- 🟢 Blue/gray cloud below price → bullish/uptrend environment
- 🔴 Red/pink cloud above price → bearish/downtrend environment
- 🟢 BUY label → potential long/buy entry
- 🔴 SELL label → potential short/sell entry
- Candles moving along one side of the cloud → trend continuation
- Cloud changing side/color → possible trend reversal
For example, the BUY around the middle of the chart occurs after price starts moving upward and the bullish cloud develops underneath it.
2. How I would use it for day trading
Don’t treat every BUY/SELL label as an automatic trade.
A better approach is:
BUY setup
- Wait for the cloud to become bullish.
- Price should be above the bullish cloud.
- Wait for a BUY signal.
- Ideally, the BUY candle should close before entering.
- Enter on the next candle or on a small pullback.
- Put SL below the recent swing low or below the cloud.
- Exit at your predefined TP or when the trend changes bearish.
SELL setup
- Wait for the cloud to become bearish.
- Price should be below the bearish cloud.
- Wait for a SELL signal.
- Allow the signal candle to close.
- Enter short on the next candle/pullback.
- SL above the recent swing high or cloud.
- Exit at TP or when the trend changes bullish.
This general approach is consistent with how ATR-based trend indicators are normally used: trend direction first, then risk management around the trend line/cloud. (Alchemy Markets)
3. Don’t enter immediately after every signal
This is the biggest mistake.
Suppose you get:
SELL → BUY → SELL → BUY
within a small range.
That usually means the market is choppy/sideways. Trend-following indicators can generate false signals in these conditions. TradingView itself notes that Supertrend-type indicators can produce false signals and work better when combined with other confirmation tools. (TradingView)
So I would avoid trades when:
- cloud is very flat
- candles repeatedly cross the cloud
- BUY and SELL signals appear close together
- there is no clear higher-high/higher-low structure
- major news is about to be released
4. A stronger confirmation method
For example, on EUR/USD 15-minute, which is what your screenshot shows:
BUY
Price above cloud
↓
Cloud bullish
↓
BUY signal
↓
Candle closes
↓
Check higher timeframe trend
↓
Enter BUY
For additional confirmation, you could use something simple such as:
- 50 EMA → trend filter
- RSI 14 → momentum confirmation
- ATR → volatility/SL calculation
For example, only take BUY signals when price is above the 50 EMA and RSI is above 50. Only take SELL signals when price is below the 50 EMA and RSI is below 50.
This reduces the number of trades, but potentially filters some weak signals. Combining trend indicators with confirmation is generally preferable to relying on a single indicator. (TradingView)
5. Stop-loss method
Don’t use a fixed 10-pip SL on every trade.
Because volatility changes, a volatility-based or structure-based stop is more sensible.
For a BUY:
Entry → recent swing low → SL
For a SELL:
Entry → recent swing high → SL
If the cloud itself acts as a trailing trend area, you can also trail the stop behind it.
ATR is particularly useful here because it measures market volatility and can adapt stops to changing conditions. (TradingView)
6. Take-profit
I’d suggest testing a minimum risk/reward framework such as:
1:1.5
or preferably:
1:2
Example:
- Risk = 20 pips
- TP = 40 pips
- Risk/Reward = 1:2
But don’t assume that 1:2 will automatically be profitable. You need to backtest the actual indicator and instrument.
7. Best way to use it on different timeframes
For day trading, I would test:
| Purpose | Timeframe |
|---|---|
| Overall trend | 1H |
| Main setup | 15M |
| Entry refinement | 5M |
| Very aggressive scalping | 1M |
A useful approach is:
1H → direction
15M → BUY/SELL setup
5M → entry
For example:
If 1H is bullish, concentrate mainly on 15M BUY signals rather than taking every SELL signal.
This is essentially a higher-timeframe trend filter, which is also used in some TradingView day-trading indicators. (TradingView)
8. Very important: is it a “90% accurate” indicator?
No indicator should be assumed to be 90%+ accurate just from the screenshot.
Your chart looks very clean because the market shown has several strong directional moves. In a sideways market, the same type of indicator can produce many losing signals. TradingView’s own Supertrend documentation explicitly warns about false signals. (TradingView)
Also, a BUY/SELL label appearing historically on a chart does not by itself prove that the indicator is non-repainting.
To verify that, we would need to inspect the actual Pine Script or test signals candle-by-candle.
9. If you want to turn this into a proper trading system
I would structure it like this:
EUR/USD 15M Day-Trading System
BUY
- 1H trend bullish
- 15M price above cloud
- Cloud bullish
- BUY signal appears
- Candle closes
- RSI > 50
- Entry
- SL below recent swing
- TP at 1.5R–2R
SELL
- 1H trend bearish
- 15M price below cloud
- Cloud bearish
- SELL signal appears
- Candle closes
- RSI < 50
- Entry
- SL above recent swing
- TP at 1.5R–2R
TradingView Indicator Installation Method :-
Step 1 – Copy/Paste Custom Code
Step 2 – Open TradingView and open any chart.
Step 3 – At the bottom of the chart, click Pine Editor.
Step 4 – Click Open → New blank indicator (or New indicator).
Step 5 – Delete the existing code.
Step 6 – Paste your custom Pine Script code.
Step 7 – Click Save and give the indicator a name.
Step 8 – Click Add to chart.
All Done – Your custom indicator will now appear on the chart
Our Payment Options:👇
1) Bitcoin Wallet:
14vtHib35eUirhcXiKRUqUs7Ejcy51gFNu
2) USDT(Tether) Wallet: (ERC20)
0x254b7bdbea655bfaf428ffd8010945b04a369114
3) TRX(Tron) Wallet: (TRC20)
TJPTi6GtfAs2P2mJaAYsR4LhdKpvsa5KE3
4) XRP(Ripple): Tag(370508805)
rNxp4h8apvRis6mJf9Sh8C6iRxfrDWN7AV
And another crypto wallet: on request
5) Visa/Master Card Via Payment Link: On Request
6) Western Union: On Request
7) This Website(www.ForexProStore.com). You can purchase directly from website by Your Credit/Debit Cards and All crypto currencies and Instant Download Indicator Files.
Send payment screenshot to: 👇🏿
Payment After we will provide product within 30 minutes.
If you want any proofs of Indicator or have any questions then feel free to message
WhatsApp: Click Here
Telegram: Click Here
Mail Us: Click Here
Thank You ❤️
Related products
TradingView Indicators
TradingView Indicators
TradingView Indicators
TradingView Indicators
TradingView Indicators
TradingView Indicators
TradingView Indicators
TradingView Indicators