
Accurate Entry Exit Signal Indicator
Original price was: $1,000.00.$200.00Current price is: $200.00.
⭐ Indicator Features
- ✅ Original & Reliable Indicator
- ⏰ 24/7 Trading — Use Anytime
- ⚡ Instant ZIP Download
- ⏱️ Timeframes: M1 to W1
- 💻 Works on Mobile, Tablet & PC
- ♾️ Unlimited TradingView Accounts
- 📊 Scalping & Intraday Strategy
- 📝 Pine Script Source Code Included
- 🌍 Works on Forex, Crypto & Stocks
- 🛠️ Customer Support & Free Updates
- 💎 One-Time Payment • Lifetime Use
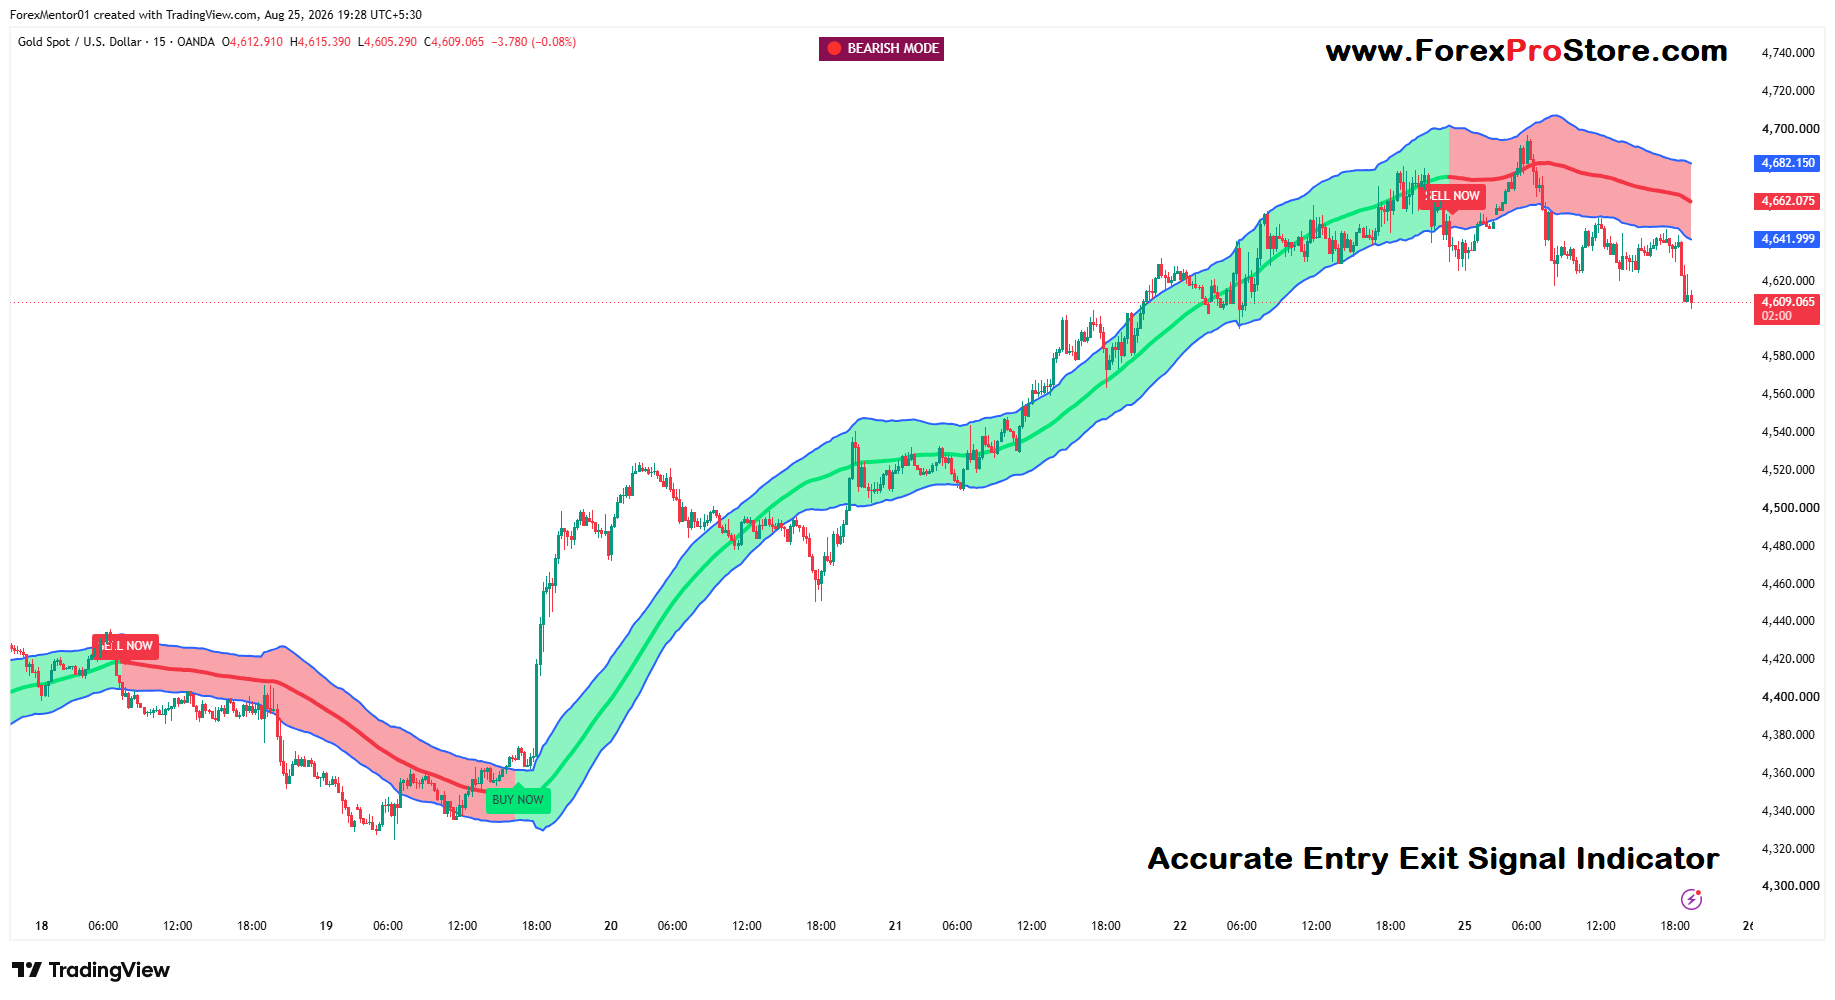
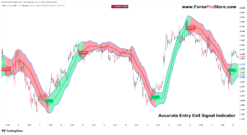
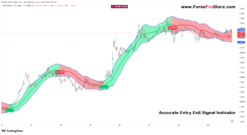
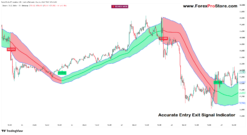
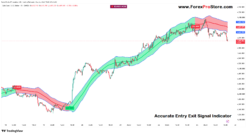
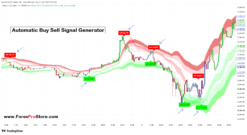
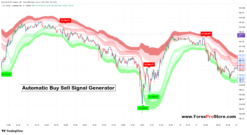
Yes. From your screenshot, this appears to be a trend + dynamic-band + Buy/Sell signal indicator. It is being used on Gold (XAU/USD), 15-minute chart. The exact formula cannot be confirmed from the screenshot alone, but we can understand how to use the visual components.
1. What the different parts mean
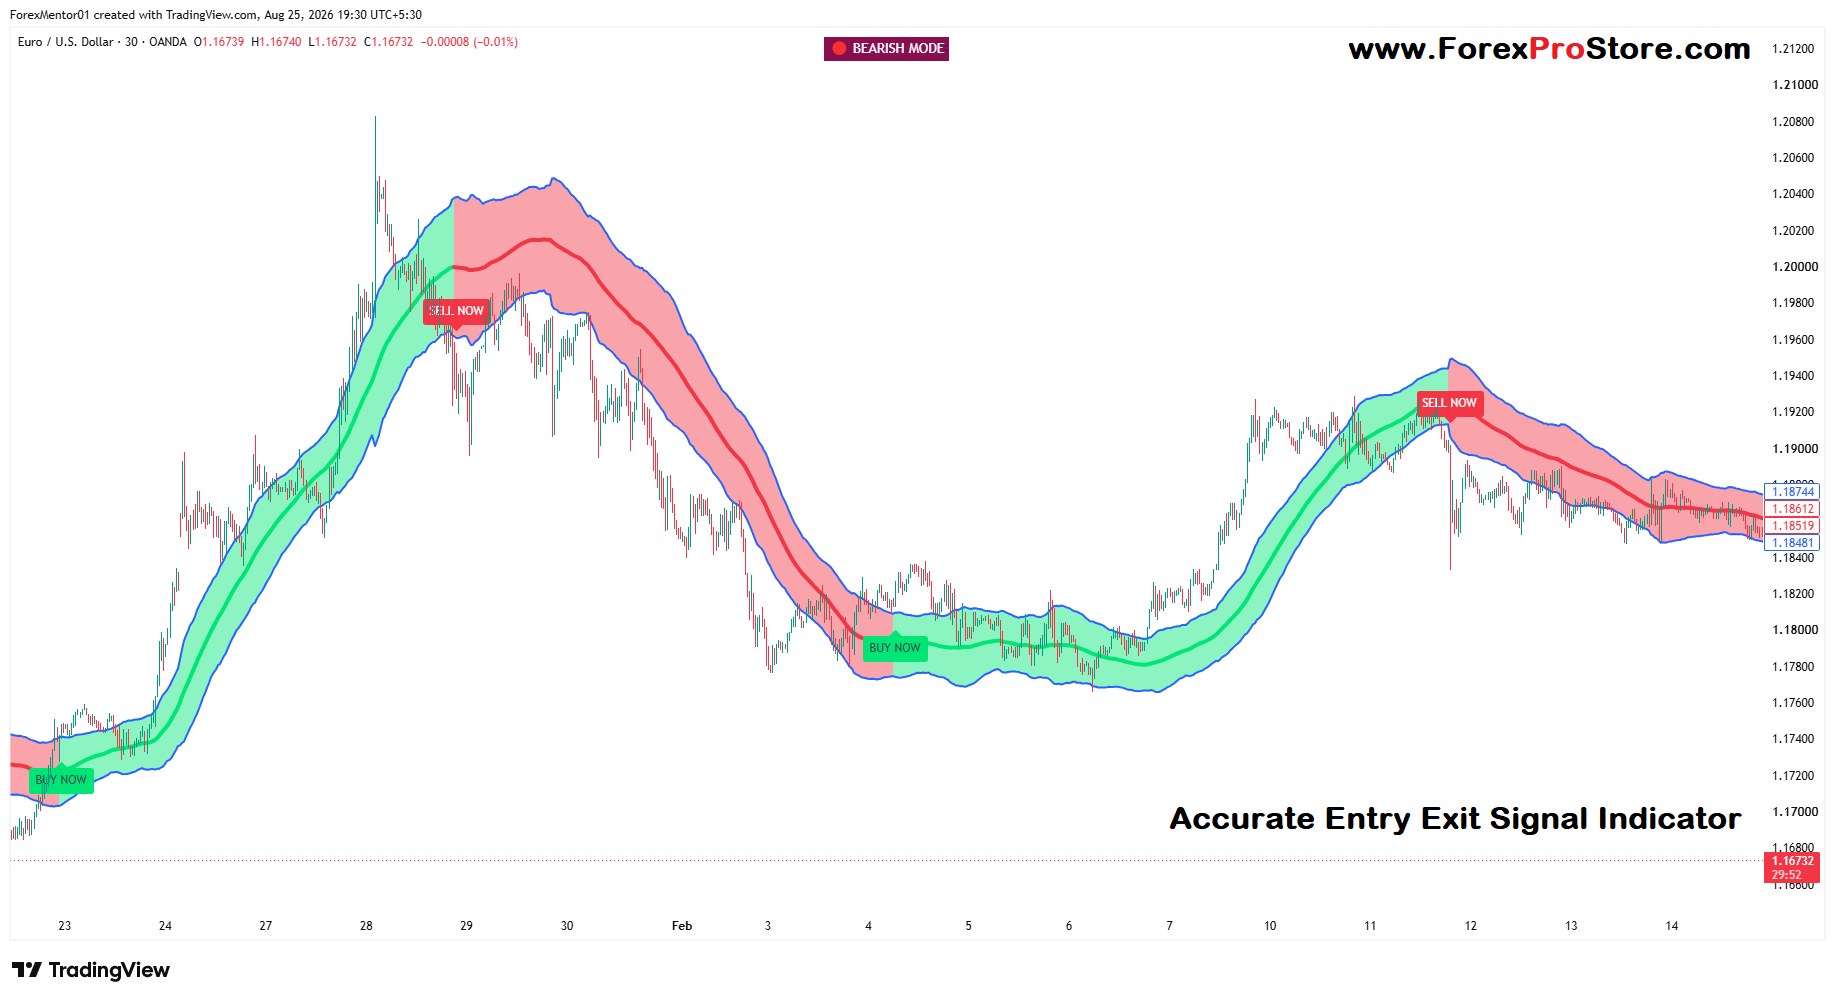
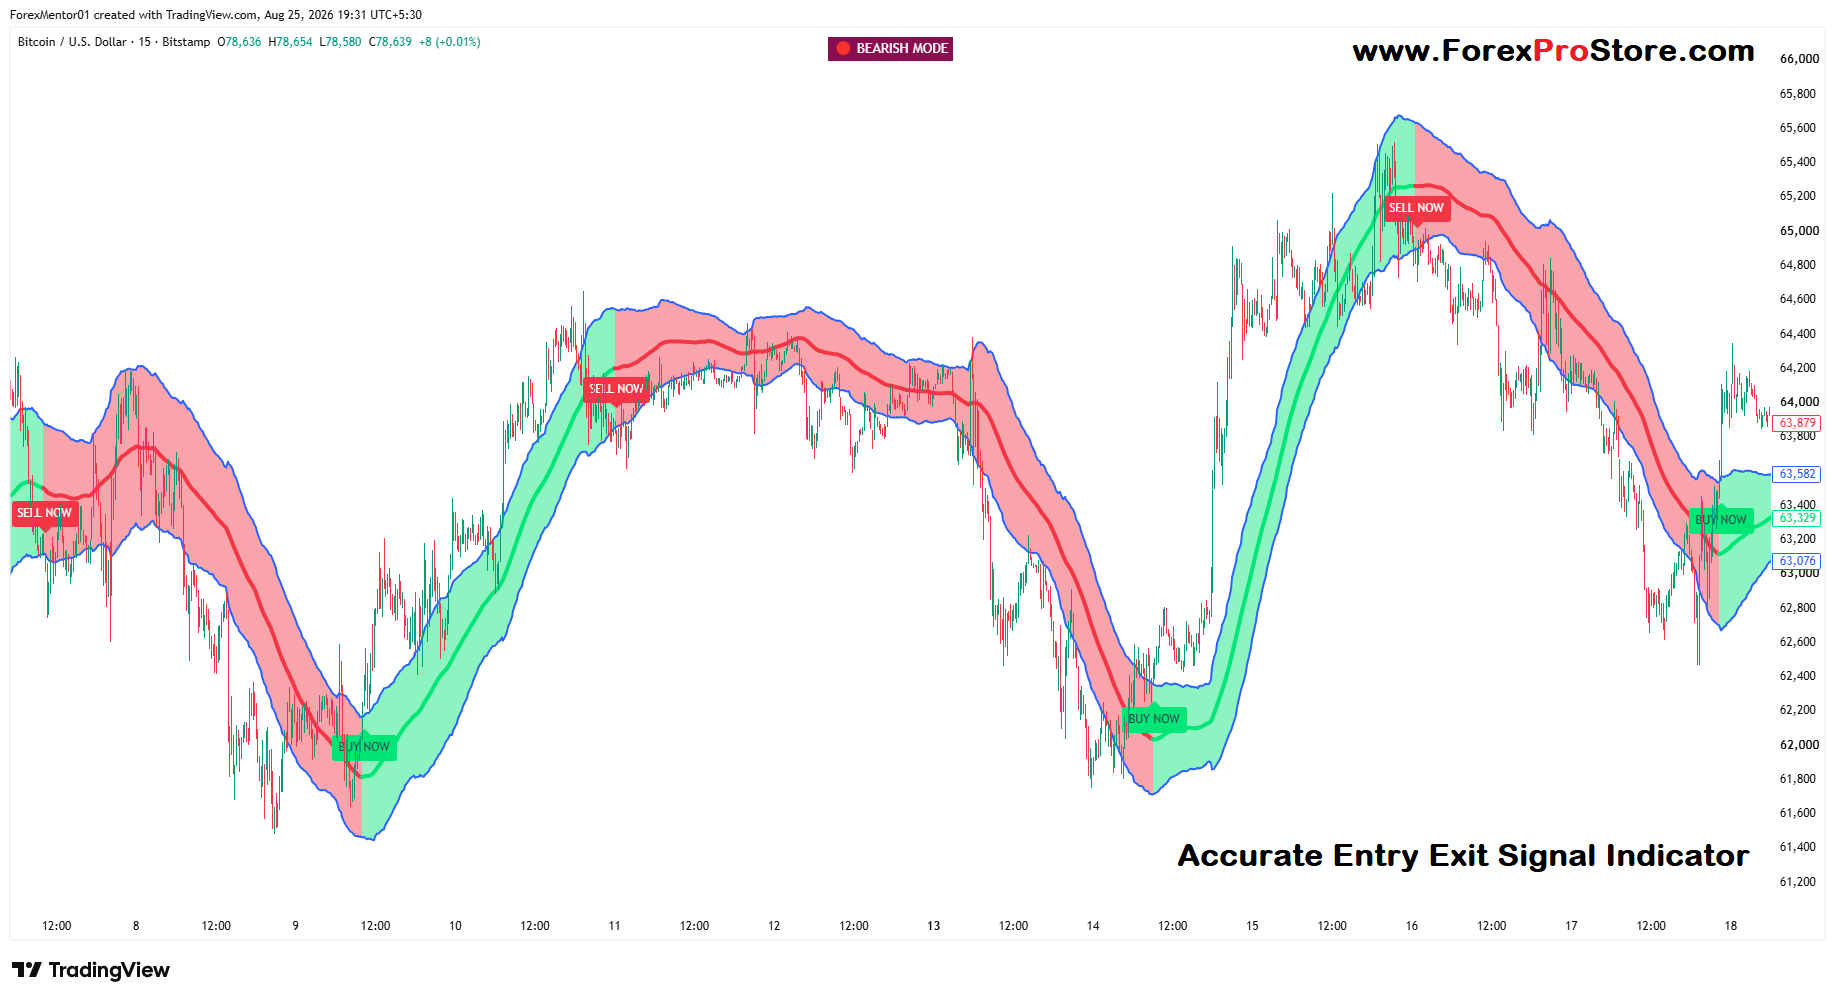
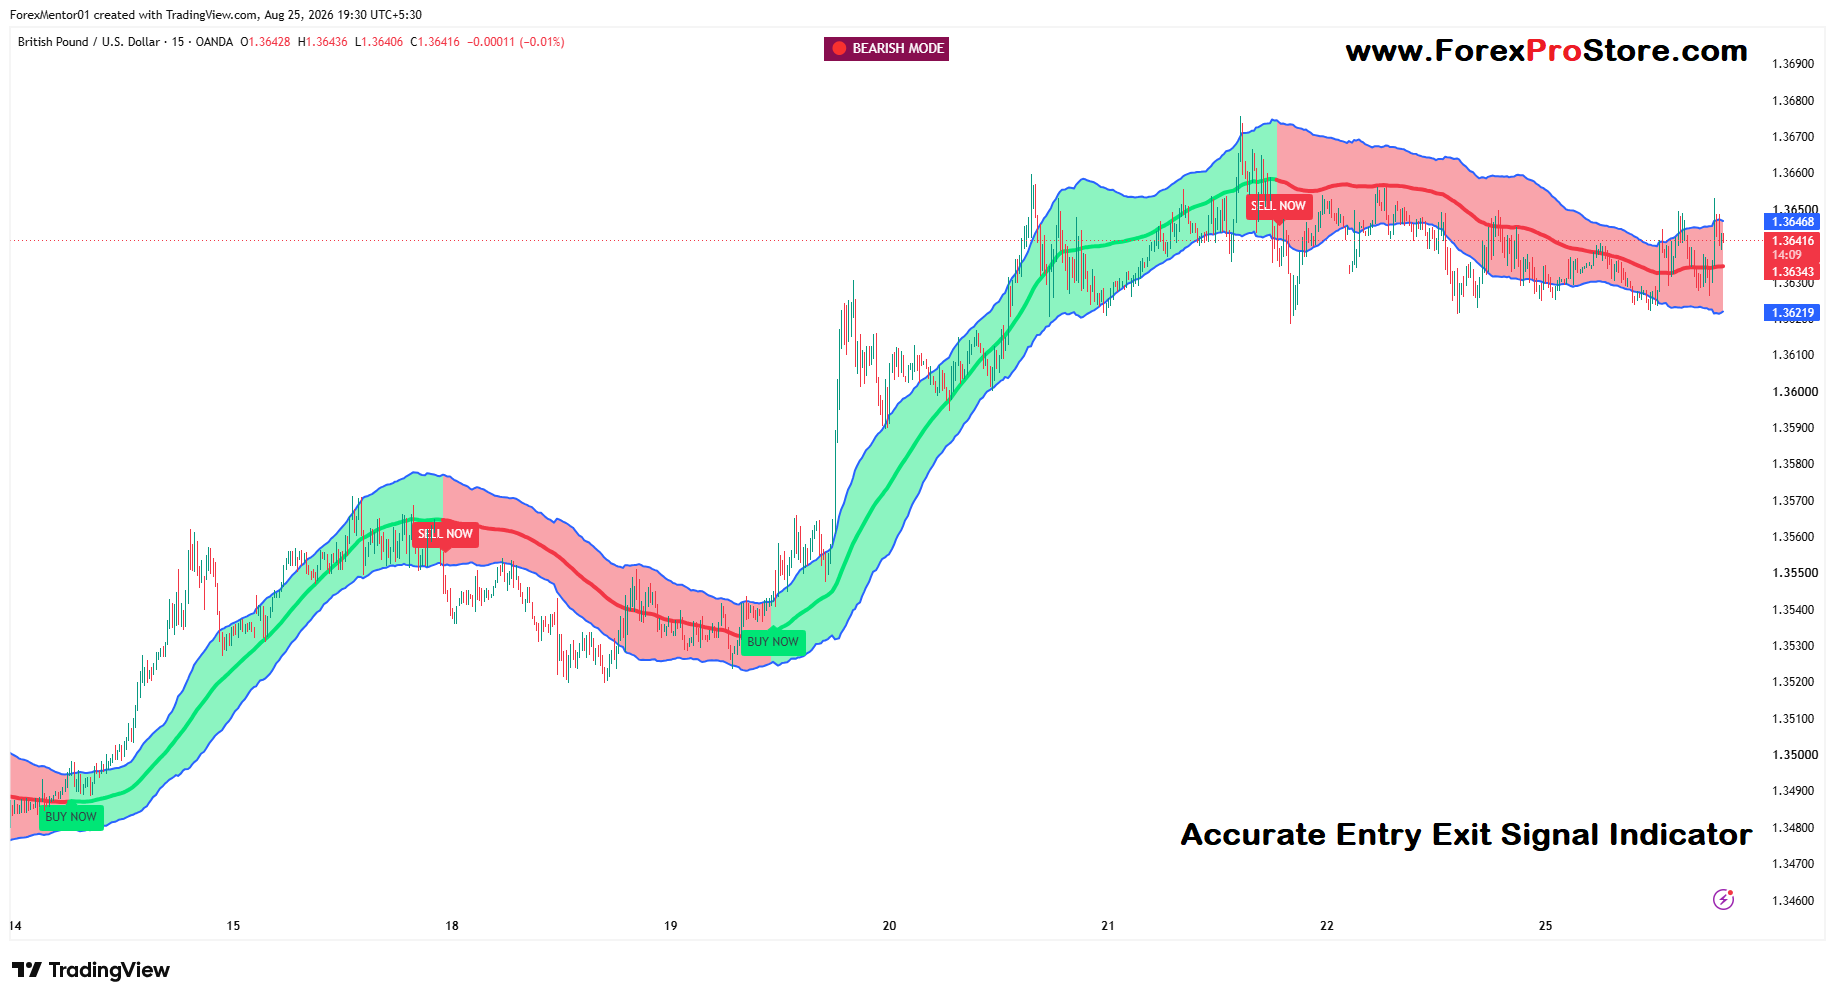
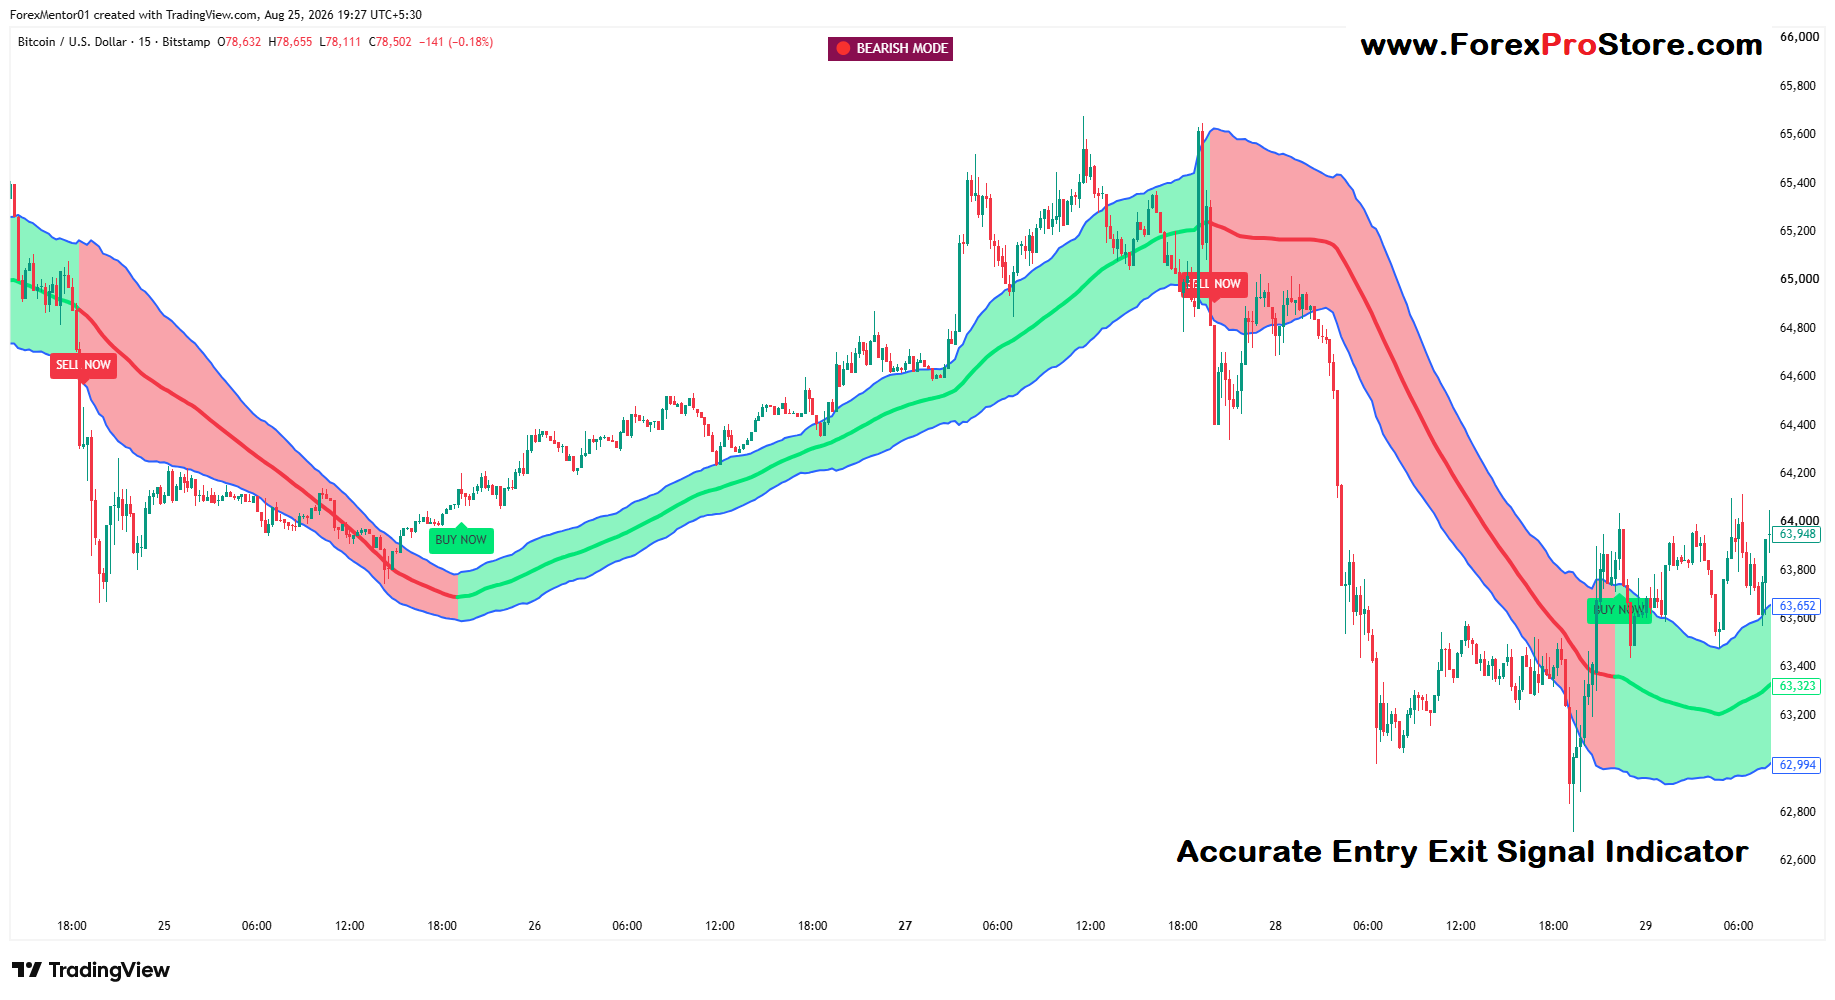
🟢 Green zone = bullish/trend-up area
When the band is green and the central line is rising, the indicator is showing that the market has bullish momentum.
Example from your chart:
- Price was moving upward.
- The green channel followed the price.
- BUY NOW appeared around the beginning of the strong upward move.
The idea is to look for buying opportunities during an established uptrend, rather than randomly buying every candle.
🔴 Red zone = bearish/trend-down area
When the channel turns red and the central line starts pointing downward, the indicator is showing bearish conditions.
On your chart, the latest area is:
BEARISH MODE → SELL NOW → price falling
So the indicator is currently warning that the short-term trend has turned bearish.
🔵 Blue outer lines = dynamic bands
These act somewhat like dynamic support/resistance or volatility boundaries. Price moving toward the upper/lower band can indicate that price is becoming extended relative to the indicator’s underlying trend calculation.
Middle line = trend/reference line
The middle red/green line is particularly useful for judging direction:
- Rising → bullish bias
- Falling → bearish bias
- Flat → market may be ranging/choppy
Moving averages are commonly used this way to smooth price and identify trend direction. (YouTube)
2. How I would use it for XAUUSD 15-minuteDon’t treat BUY NOW or SELL NOW as an automatic order.
Use a simple confirmation system:
🟢 BUY setup
Look for:
- Indicator is green/bullish.
- Middle line is pointing upward.
- Price is above/around the middle line.
- A BUY NOW signal appears.
- Wait for the signal candle to close.
- Check the higher timeframe, preferably 1H, for bullish direction.
- Enter after confirmation rather than immediately on an intrabar signal.
Stop-loss: below the recent swing low.
Take-profit: previous resistance, upper band, or use a risk/reward target such as 1:1.5 or 1:2.
🔴 SELL setup
Look for:
- Indicator changes to red/bearish.
- Middle line starts pointing downward.
- Price moves below the middle line.
- SELL NOW appears.
- Wait for candle close.
- Confirm that the 1H trend isn’t strongly bullish.
- Enter short after confirmation.
Stop-loss: above the recent swing high.
Take-profit: previous support/lower band or a predefined risk/reward target.
3. Your screenshot — what happened?
Your chart is actually a good example.
The sequence appears to be:
Red → BUY → strong green trend → SELL → red/bearish
The large bullish move started around the 4,340–4,360 area and continued toward approximately 4,700.
Later, the indicator generated SELL NOW around the 4,660–4,680 area.
The current price shown is approximately 4,609, so the market has already moved substantially downward from that sell area.
That demonstrates one of the major benefits of this type of indicator:
It attempts to keep you on the trend instead of requiring you to predict the exact top or bottom.
But importantly, a historical chart can make signals look much easier than they are in live trading.
4. The biggest benefit
✅ Trend identification
Instead of looking at dozens of candles, you can quickly see:
Green = look for buys
Red = look for sells
This can make a chart much easier to read.
✅ Entry timing
The BUY/SELL labels can help you identify potential entry points.
✅ Exit timing
A change from green → red can be used as an exit warning for a long position.
Likewise, red → green can warn that a short position may need to be closed.
✅ Dynamic support/resistance
The bands can help you identify areas where price is relatively extended. Similar band-based indicators are often used to identify potential reversals or mean-reversion areas. (TradingView)
✅ Less chart clutter
You don’t necessarily need 5–10 indicators. A trend-band indicator can provide trend direction, dynamic levels and signals in one view.
5. A simple XAUUSD strategy
For a beginner, I’d keep it very simple:
| Condition | Action |
|---|---|
| 🟢 Green + rising middle line | Look for BUY |
| 🔴 Red + falling middle line | Look for SELL |
| Green but price at major resistance | Avoid chasing BUY |
| Red but price at major support | Avoid chasing SELL |
| Sideways/flat bands | Avoid |
| BUY + bullish 1H confirmation | Stronger setup |
| SELL + bearish 1H confirmation | Stronger setup |
Example
Suppose XAUUSD is on 15M:
1H: bullish
↓
15M: turns green
↓
BUY NOW appears
↓
Candle closes bullish
↓
Price holds above middle line
↓
BUY
SL → recent swing low
TP → resistance / 1:2 R:R
That is much better than simply clicking BUY whenever the label appears.
6. One thing I would NOT do
Don’t do this:
BUY → price goes against you → BUY more → BUY more → BUY more
or
SELL → price goes against you → SELL more → SELL more
Especially on XAUUSD, this can become dangerous very quickly.
Use a fixed risk per trade and a predefined stop-loss.
TradingView Indicator Installation Method :-
Step 1 – Copy/Paste Custom Code
Step 2 – Open TradingView and open any chart.
Step 3 – At the bottom of the chart, click Pine Editor.
Step 4 – Click Open → New blank indicator (or New indicator).
Step 5 – Delete the existing code.
Step 6 – Paste your custom Pine Script code.
Step 7 – Click Save and give the indicator a name.
Step 8 – Click Add to chart.
All Done – Your custom indicator will now appear on the chart
Our Payment Options:👇
1) Bitcoin Wallet:
14vtHib35eUirhcXiKRUqUs7Ejcy51gFNu
2) USDT(Tether) Wallet: (ERC20)
0x254b7bdbea655bfaf428ffd8010945b04a369114
3) TRX(Tron) Wallet: (TRC20)
TJPTi6GtfAs2P2mJaAYsR4LhdKpvsa5KE3
4) XRP(Ripple): Tag(370508805)
rNxp4h8apvRis6mJf9Sh8C6iRxfrDWN7AV
And another crypto wallet: on request
5) Visa/Master Card Via Payment Link: On Request
6) Western Union: On Request
7) This Website(www.ForexProStore.com). You can purchase directly from website by Your Credit/Debit Cards and All crypto currencies and Instant Download Indicator Files.
Send payment screenshot to: 👇🏿
Payment After we will provide product within 30 minutes.
If you want any proofs of Indicator or have any questions then feel free to message
WhatsApp: Click Here
Telegram: Click Here
Mail Us: Click Here
Thank You ❤️
Related products
TradingView Indicators
TradingView Indicators
TradingView Indicators
TradingView Indicators
TradingView Indicators
TradingView Indicators
TradingView Indicators
TradingView Indicators