
-
×
 Forex Trend Power Indicator
4 × $80.00
Forex Trend Power Indicator
4 × $80.00 -
×
 Forex Money Flow Alert Indicator
4 × $289.00
Forex Money Flow Alert Indicator
4 × $289.00 -
×
 Ultimate Trend Following Indicator
4 × $209.00
Ultimate Trend Following Indicator
4 × $209.00 -
×
 Agimat FX 2020 Pro
4 × $129.00
Agimat FX 2020 Pro
4 × $129.00 -
×
 Swing Breakout Trading Indicator
4 × $145.00
Swing Breakout Trading Indicator
4 × $145.00 -
×
 Box Indicator 100% Non-Repaint
9 × $89.00
Box Indicator 100% Non-Repaint
9 × $89.00 -
×
 Buy-Sell Indicator 100% Non Repaint
4 × $68.00
Buy-Sell Indicator 100% Non Repaint
4 × $68.00 -
×
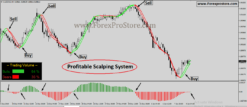 Profitable Scalping System
4 × $70.00
Profitable Scalping System
4 × $70.00 -
×
 Advanced Parabolic Sar Indicator
12 × $135.00
Advanced Parabolic Sar Indicator
12 × $135.00 -
×
 100% Non Repaint Indicator V17.0
4 × $275.00
100% Non Repaint Indicator V17.0
4 × $275.00 -
×
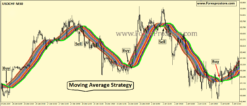 Moving Average Strategy
4 × $80.00
Moving Average Strategy
4 × $80.00 -
×
 100% Non Repaint Indicator V16.0
2 × $159.00
100% Non Repaint Indicator V16.0
2 × $159.00 -
×
 Buy-Sell Indicator 100% Non-Repaint
14 × $79.00
Buy-Sell Indicator 100% Non-Repaint
14 × $79.00 -
×
 Trend Reverse Indicator 100% Non-Repaint
4 × $65.00
Trend Reverse Indicator 100% Non-Repaint
4 × $65.00 -
×
 100% Non-Repaint Indicator V1.0
2 × $249.00
100% Non-Repaint Indicator V1.0
2 × $249.00 -
×
 Moving Average King Indicator 100% non Repaint
2 × $80.00
Moving Average King Indicator 100% non Repaint
2 × $80.00 -
×
 100% Non Repaint Indicator V4.0
2 × $129.00
100% Non Repaint Indicator V4.0
2 × $129.00 -
×
 100% Non Repaint Indicator V19.0
6 × $205.00
100% Non Repaint Indicator V19.0
6 × $205.00 -
×
 100% Non Repaint Indicator V5.0
4 × $168.00
100% Non Repaint Indicator V5.0
4 × $168.00 -
×
 Forex Killer Indicator 100% Non Repaint
4 × $249.00
Forex Killer Indicator 100% Non Repaint
4 × $249.00 -
×
 50 Pips Scalping Indicator
4 × $129.00
50 Pips Scalping Indicator
4 × $129.00 -
×
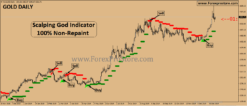 Scalping God Indicator 100% Non-Repaint
3 × $119.00
Scalping God Indicator 100% Non-Repaint
3 × $119.00 -
×
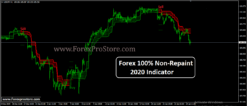 Forex 100% Non-Repaint 2020 Indicator
2 × $169.00
Forex 100% Non-Repaint 2020 Indicator
2 × $169.00 -
×
 Powerful Scalping Indicator 100% Non-Repaint
4 × $169.00
Powerful Scalping Indicator 100% Non-Repaint
4 × $169.00 -
×
 Currency strength With Alerts Cross Indicator
4 × $110.00
Currency strength With Alerts Cross Indicator
4 × $110.00 -
×
 Buy-Sell Trend Arrow Indicator
1 × $259.00
Buy-Sell Trend Arrow Indicator
1 × $259.00 -
×
 Short Scalping Indicator
6 × $95.00
Short Scalping Indicator
6 × $95.00 -
×
 Powerful Histogram Scalping Indicator
4 × $179.00
Powerful Histogram Scalping Indicator
4 × $179.00 -
×
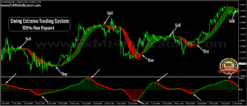 Swing Extreme Trading System
4 × $125.00
Swing Extreme Trading System
4 × $125.00 -
×
 100% Non Repaint Indicator V18.0
2 × $190.00
100% Non Repaint Indicator V18.0
2 × $190.00 -
×
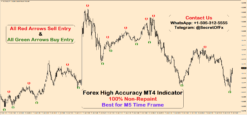 Forex High Accuracy MT4 Indicator
2 × $195.00
Forex High Accuracy MT4 Indicator
2 × $195.00 -
×
 100% Non Repaint Indicator V11.0
2 × $139.00
100% Non Repaint Indicator V11.0
2 × $139.00 -
×
 Million Dollar Indicator
2 × $400.00
Million Dollar Indicator
2 × $400.00 -
×
 Trend Arrows Scalper
2 × $110.00
Trend Arrows Scalper
2 × $110.00 -
×
 100% Non Repaint Indicator V13.0
2 × $209.00
100% Non Repaint Indicator V13.0
2 × $209.00 -
×
 100% Non Repaint Indicator V27.0
2 × $75.00
100% Non Repaint Indicator V27.0
2 × $75.00 -
×
 Current Trend Dots Alert Indicator
4 × $139.00
Current Trend Dots Alert Indicator
4 × $139.00 -
×
 Triple Bollinger Bands Indicator
2 × $50.00
Triple Bollinger Bands Indicator
2 × $50.00 -
×
 100% Non-Repaint Indicator
2 × $249.00
100% Non-Repaint Indicator
2 × $249.00 -
×
 Dynamic Reversal Indicator 100% Non-Repaint
2 × $139.00
Dynamic Reversal Indicator 100% Non-Repaint
2 × $139.00 -
×
 100% Non Repaint Indicator V3.0
2 × $229.00
100% Non Repaint Indicator V3.0
2 × $229.00 -
×
 100% Non Repaint Indicator V23.0
2 × $204.00
100% Non Repaint Indicator V23.0
2 × $204.00 -
×
 100 Pips No Repaint Indicator
2 × $250.00
100 Pips No Repaint Indicator
2 × $250.00 -
×
 Accurate Arrow Signal Indicator
2 × $190.00
Accurate Arrow Signal Indicator
2 × $190.00 -
×
 100% Non Repaint Indicator V15.0
2 × $239.00
100% Non Repaint Indicator V15.0
2 × $239.00
Blog
10 Best Indicators for Spotting Trend Reversals

Identifying trend reversals properly is a critical ability that distinguishes successful traders from the rest. Whether you trade forex, gold, stocks, or cryptocurrency, knowing when a trend is poised to reverse may help you get in early, maximize gains, and minimize losses. To help with this process, traders use technical indicators that show momentum fluctuations, overbought/oversold levels, and price exhaustion. The 10 greatest indicators for recognizing trend reversals are shown below, with each providing distinct insights into market behavior. 10 Best Indicators for Spotting Trend Reversals
Download Now Non-Repaint Indicator
Telegram Channel Visit Now
Fund Management Services Visit Now
1: Relative Strength Index (RSI) – 10 Best Indicators for Spotting Trend Reversals
On a scale of 0 to 100, the RSI assesses the speed and change in price movements. When the RSI becomes overbought (above 70) or oversold (below 30), a reversal is usually expected.
Why It Works:
When RSI diverges from price (e.g., price makes a higher high while RSI makes a lower high), it often indicates waning momentum and a possible reversal.
2. Moving Average Convergence Divergence (MACD)
MACD measures the connection between two moving averages. The signal is produced by crosses between the MACD and signal lines, or when the histogram changes direction.
Why It Works:
When the MACD line crosses below the signal line after a lengthy uptrend, or vice versa, it might imply a change in momentum and an impending reversal.
Read also this
What Are Non-Repaint MT4 Scalping Indicators
10 Must-Have No Repaint Indicators for Every Forex Trader
Why Choose a Non-Repainting Indicator for Trading
10 Best Indicators for Spotting Trend Reversals
The Benefits of Using Non-Repaint Arrow Indicators in MT4
When Is the Best Time to Use Buy Sell Signals
3. Stochastic oscillator
This momentum indicator compares a certain closing price to a range of previous values over a given time period. It’s particularly beneficial for identifying reversals in range-bound markets.
Why It Works:
A bullish reversal is anticipated when the%K line crosses above the%D line from below 20, and a negative reversal when it crosses below from above 80.
4. Parabolic SAR (Stop and Reverse) – 10 Best Indicators for Spotting Trend Reversals
Parabolic SAR plots dots above and below the price. A change in the location of the dot indicates a potential shift in trend direction.
Why It Works:
It responds to price activity and assists traders in identifying short-term reversals, particularly when paired with other indicators like as moving averages.
5. Bollinger Bands
Bollinger Bands are made up of a moving average and two standard deviation bands. Price touching or breaking out of the bands may indicate a probable reversal.
Why It Works:
When price closes outside of the bands and soon reenters, it usually suggests price fatigue and an impending reversal.
6. VOLUME
Volume is sometimes underestimated, but growing volume during a price reversal shows a change in market mood. Declining volume in a trend may also indicate a faltering trend.
Why It Works:
A bullish reversal supported by increased purchasing volume strengthens the indication. The same is true for selling pressure in a decline.
7. Fibonacci Retracement Levels – 10 Best Indicators for Spotting Trend Reversals
These are horizontal lines that show where support and resistance are expected to appear. The critical levels (38.2%, 50%, and 61.8%) sometimes serve as reversal markers.
Why It Works:
Price often reverses at Fibonacci levels when paired with additional indicators or powerful price action patterns.
8 Average Directional Index (ADX)
While ADX does not indicate direction, it does demonstrate the strength of a trend. When ADX starts to drop, it may indicate that the present trend is losing steam.
Why It Works:
A decreasing ADX along with divergence in other indicators might indicate a potential reversal.
9: Candle Patterns (e.g., Engulfing, Doji, Hammer)
Price action patterns provide a visual cue for detecting reversals. Key reversal candles often arise at peaks or bottoms, and they function much better when indicator confluence occurs.
Why It Works:
A bullish engulfing or hammer at a support zone, or a bearish engulfing at resistance, is a powerful reversal indicator, particularly when supported by volume or RSI.
Download Now Non-Repaint Indicator
Telegram Channel Visit Now
Fund Management Services Visit Now
10. ZigZag Indicator – 10 Best Indicators for Spotting Trend Reversals
The ZigZag indicator removes small price changes to assist spot significant price swings and patterns.
Why It Works:
It allows traders to see unambiguous highs and lows, making it simpler to identify trend reversals and patterns such as head and shoulders or double tops/bottoms.

Final Thoughts
Identifying trend reversals is not a guessing game; it is about employing the proper tools in the correct situation. While no one indicator can completely identify reversals, combining the above — such as RSI + MACD + candle patterns — considerably improves accuracy. Always check for confluence: when numerous indications agree, the probability of a successful reverse trade increases. Most importantly, always control your risk, since even the greatest signals may fail in unpredictable markets.
By learning these ten indications, you’ll be able to identify trend reversals early and trade them with more confidence and success.