
Breakout Detection Indicator TradingView
Original price was: $1,200.00.$320.00Current price is: $320.00.
⭐ Indicator Features
- ✅ Original & Reliable Indicator
- ⏰ 24/7 Trading — Use Anytime
- ⚡ Instant ZIP Download
- ⏱️ Timeframes: M1 to W1
- 💻 Works on Mobile, Tablet & PC
- ♾️ Unlimited TradingView Accounts
- 📊 Scalping & Intraday Strategy
- 📝 Pine Script Source Code Included
- 🌍 Works on Forex, Crypto & Stocks
- 🛠️ Customer Support & Free Updates
- 💎 One-Time Payment • Lifetime Use
Breakout Detection Indicator – How to Use It and Its Benefits
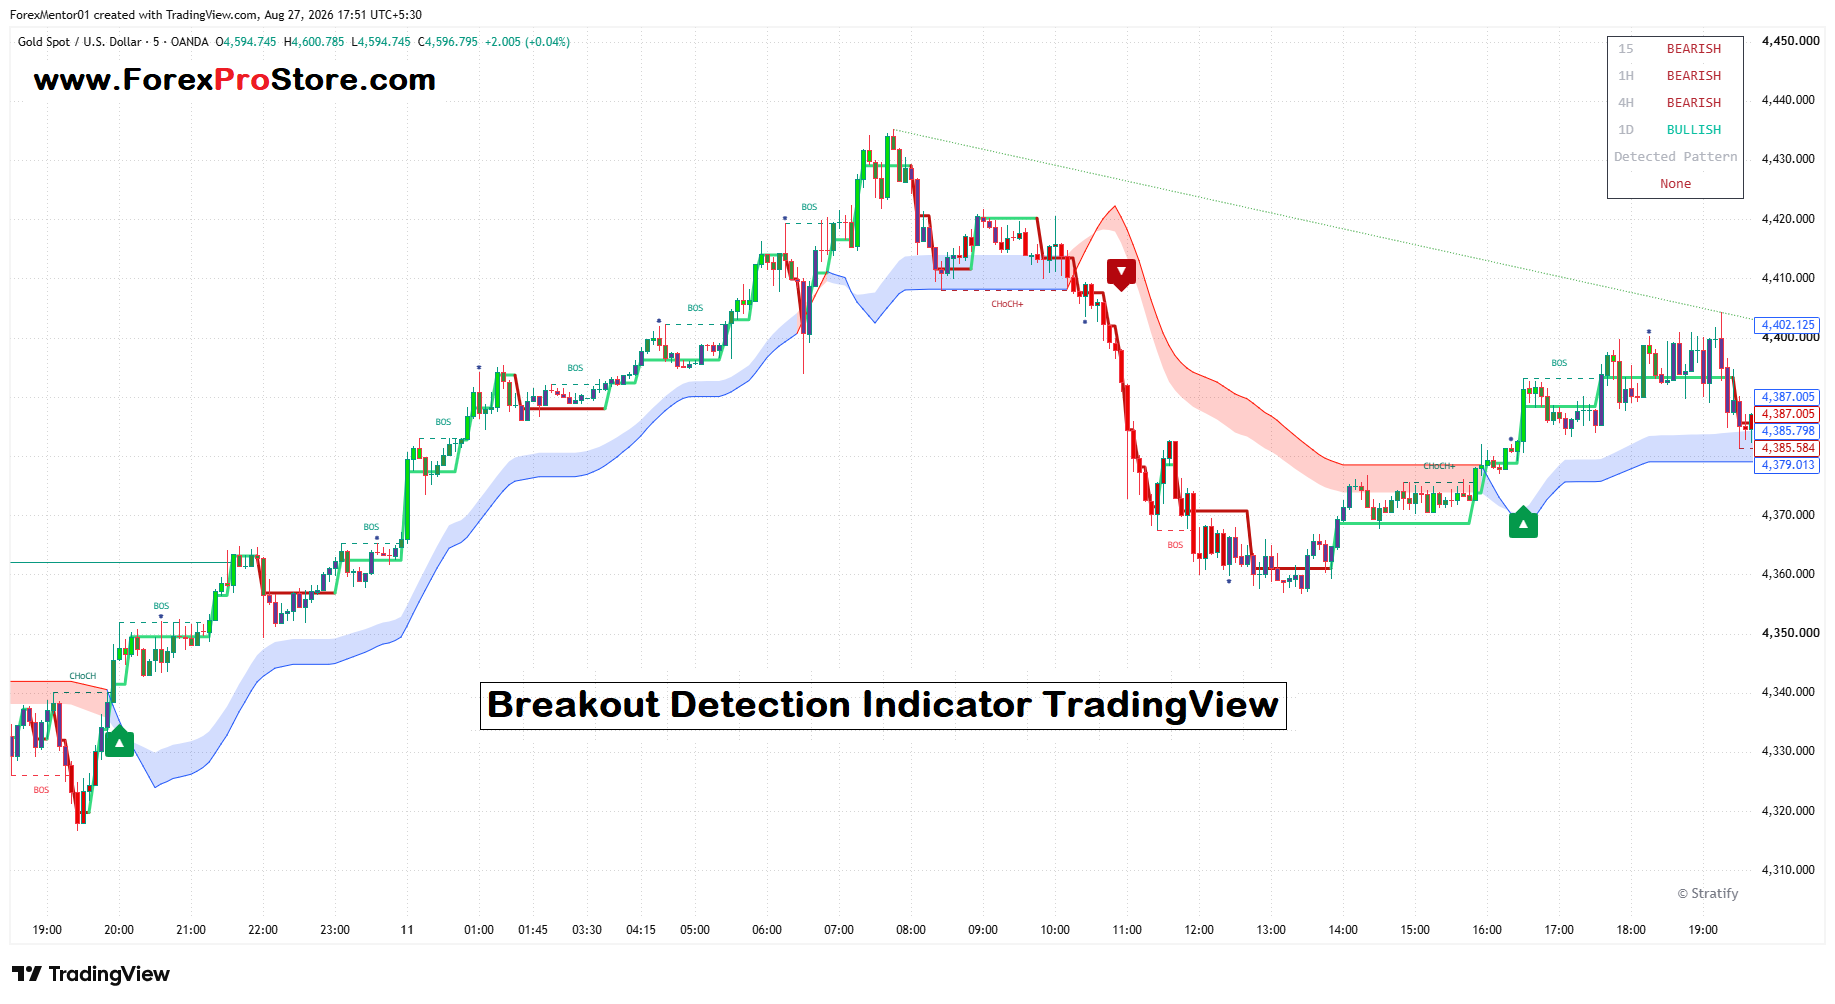
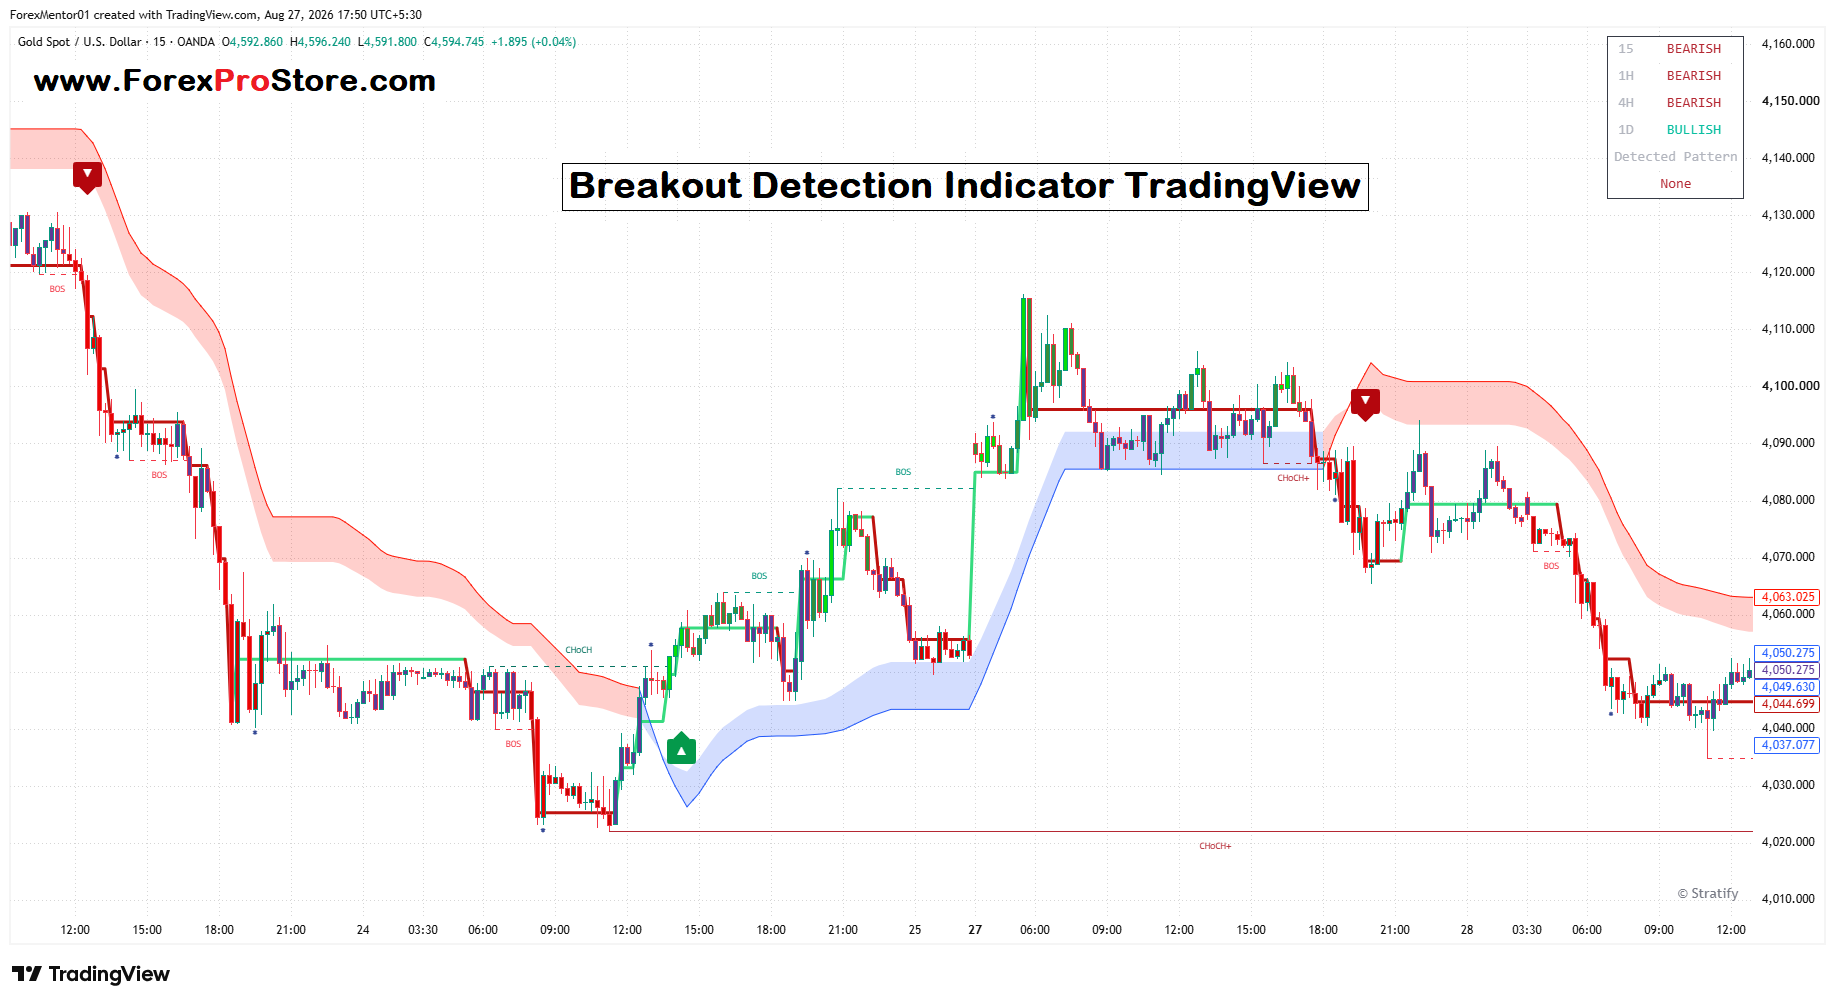
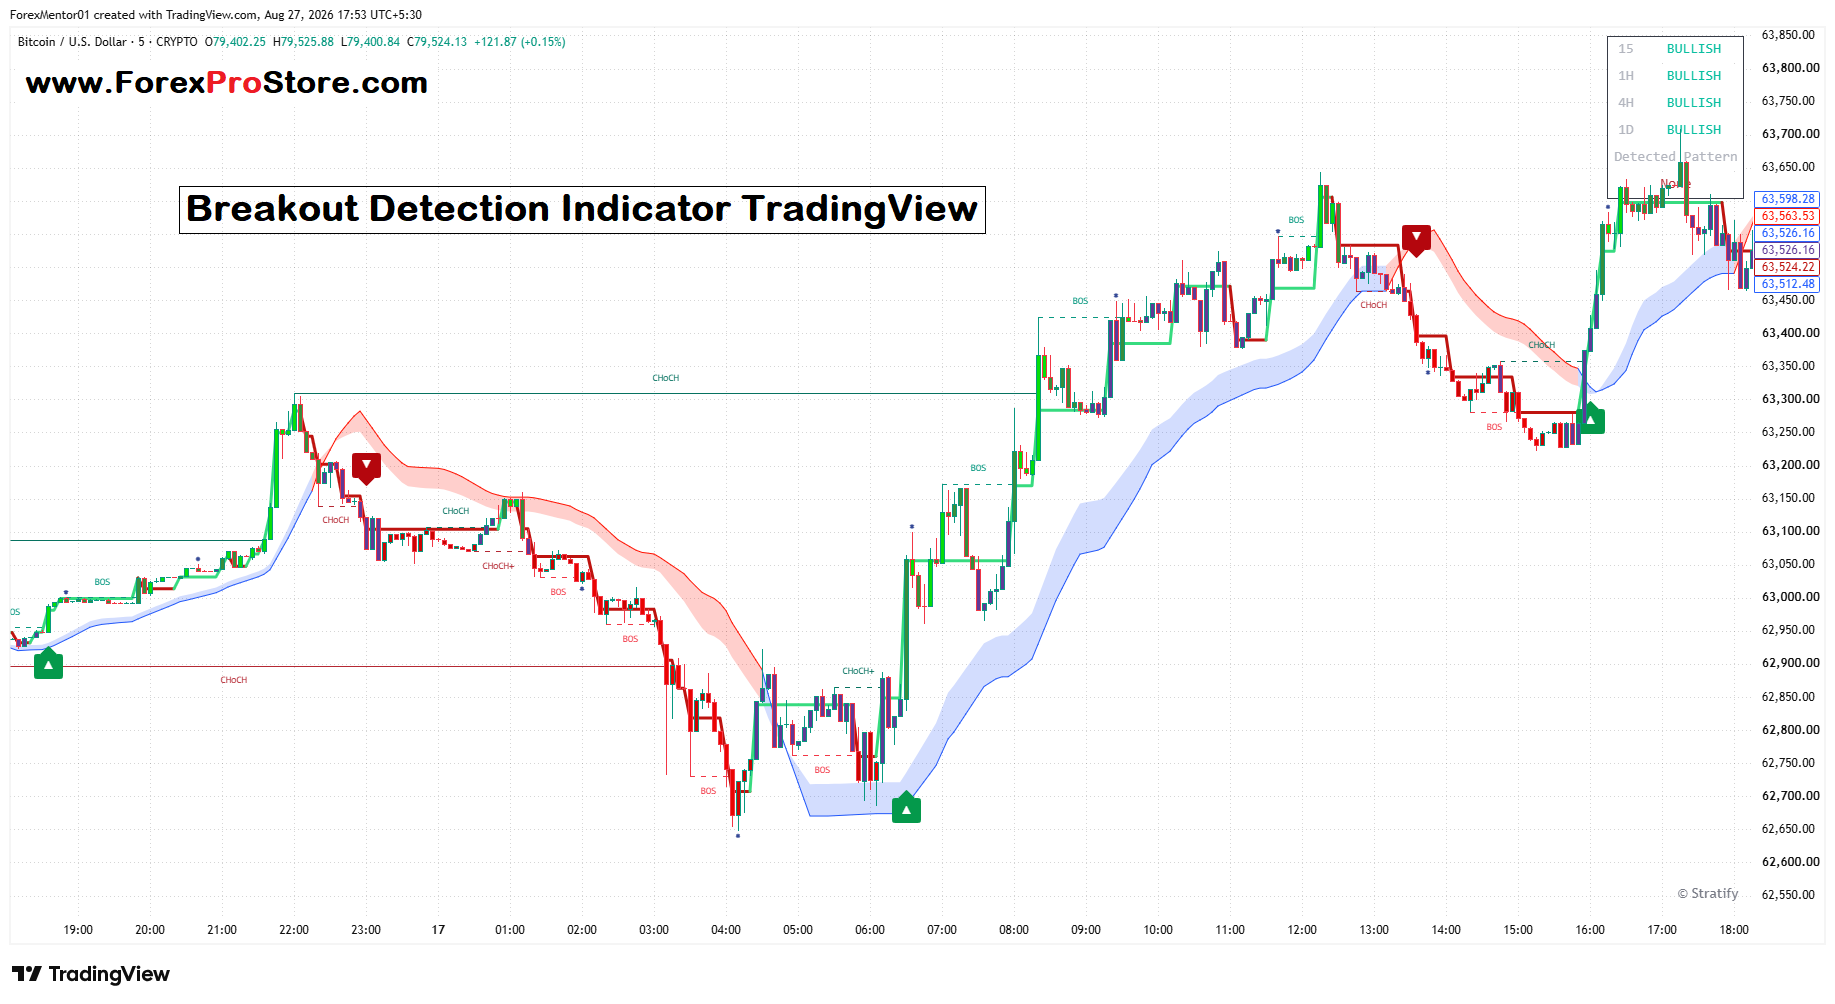
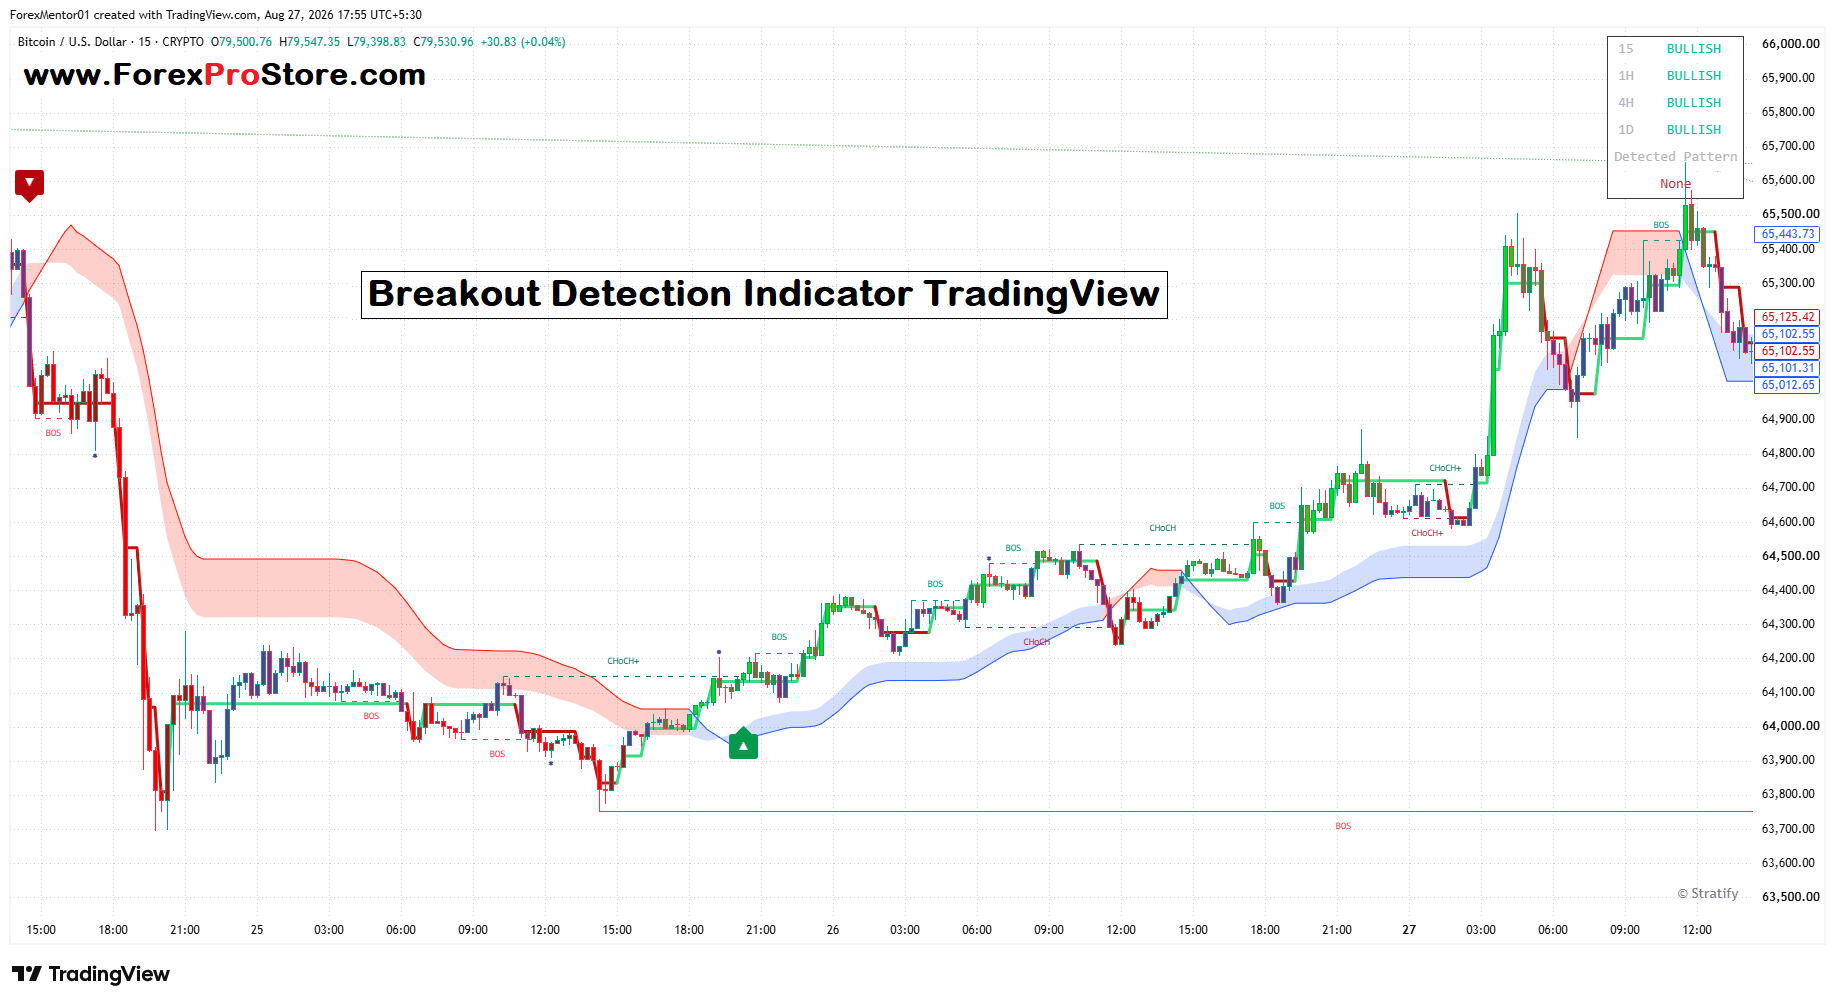
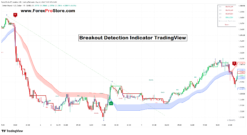
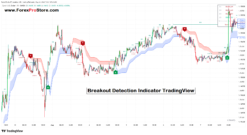
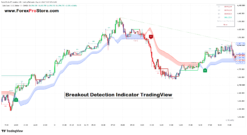
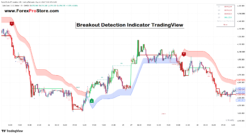
The Breakout Detection Indicator for TradingView is designed to help traders identify possible trend changes, breakouts, bullish/bearish momentum, and important market-structure levels. It can make the chart easier to understand by showing visual signals instead of requiring you to manually identify every swing high and swing low.
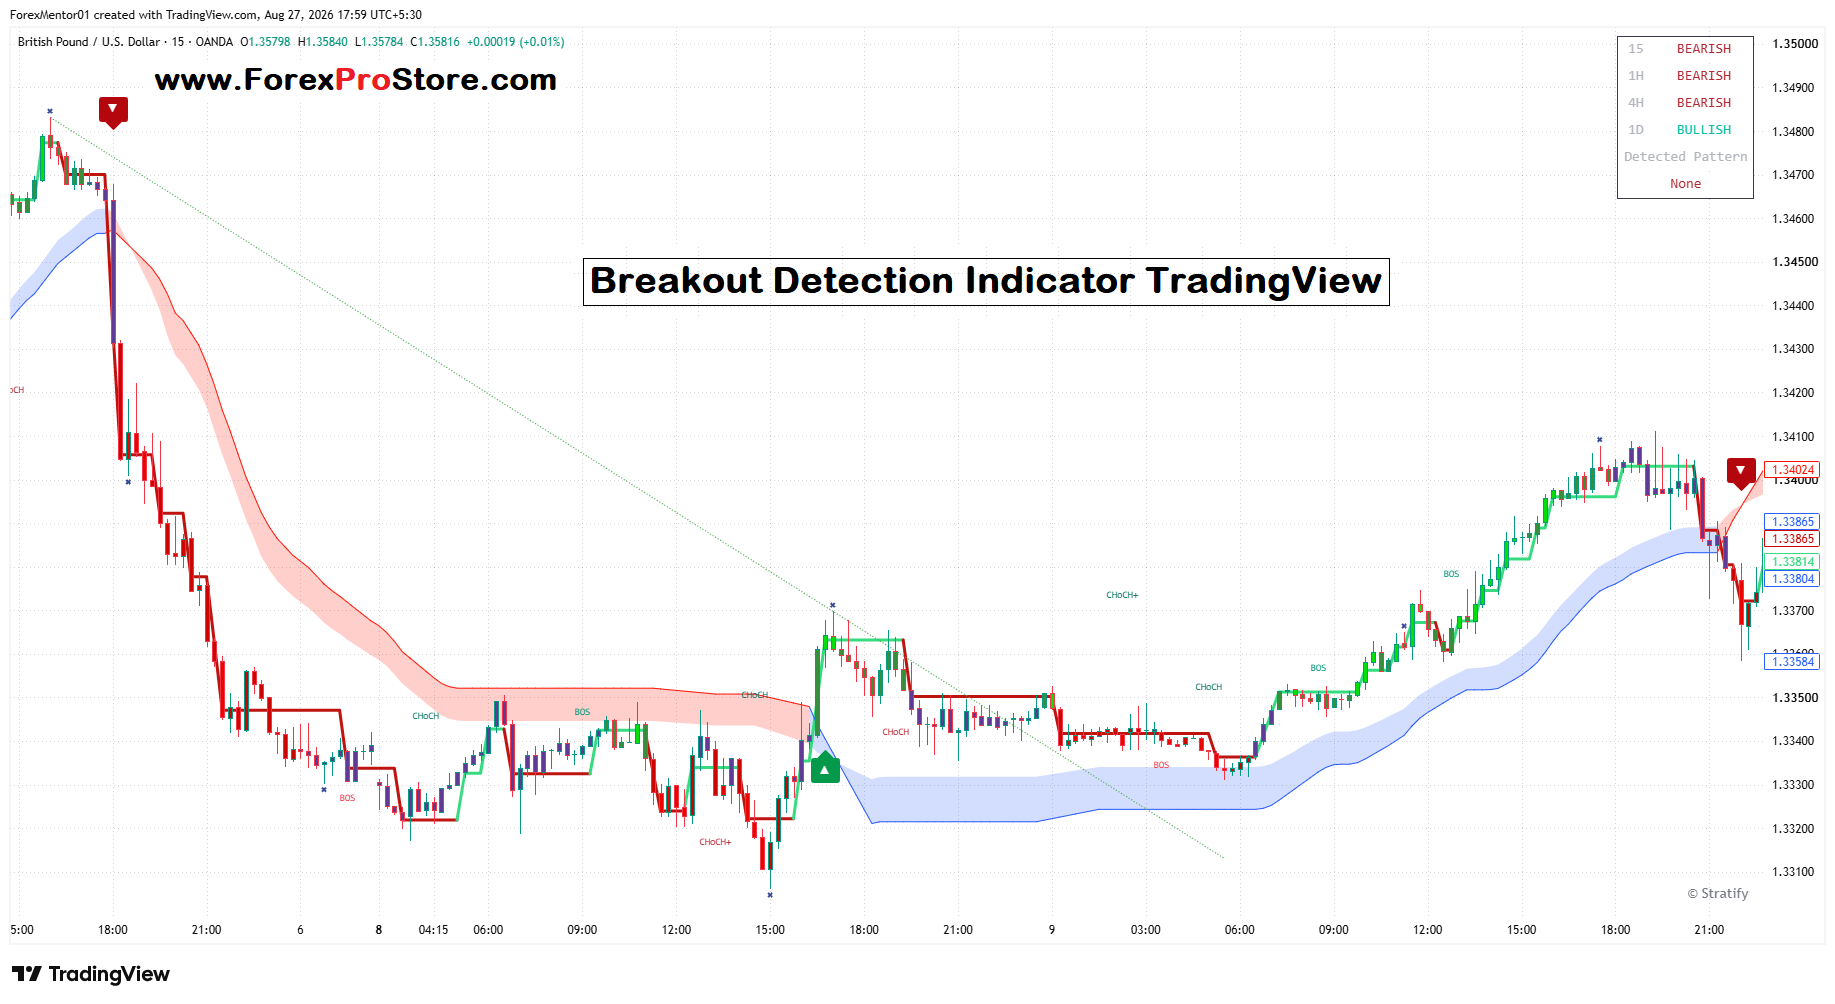
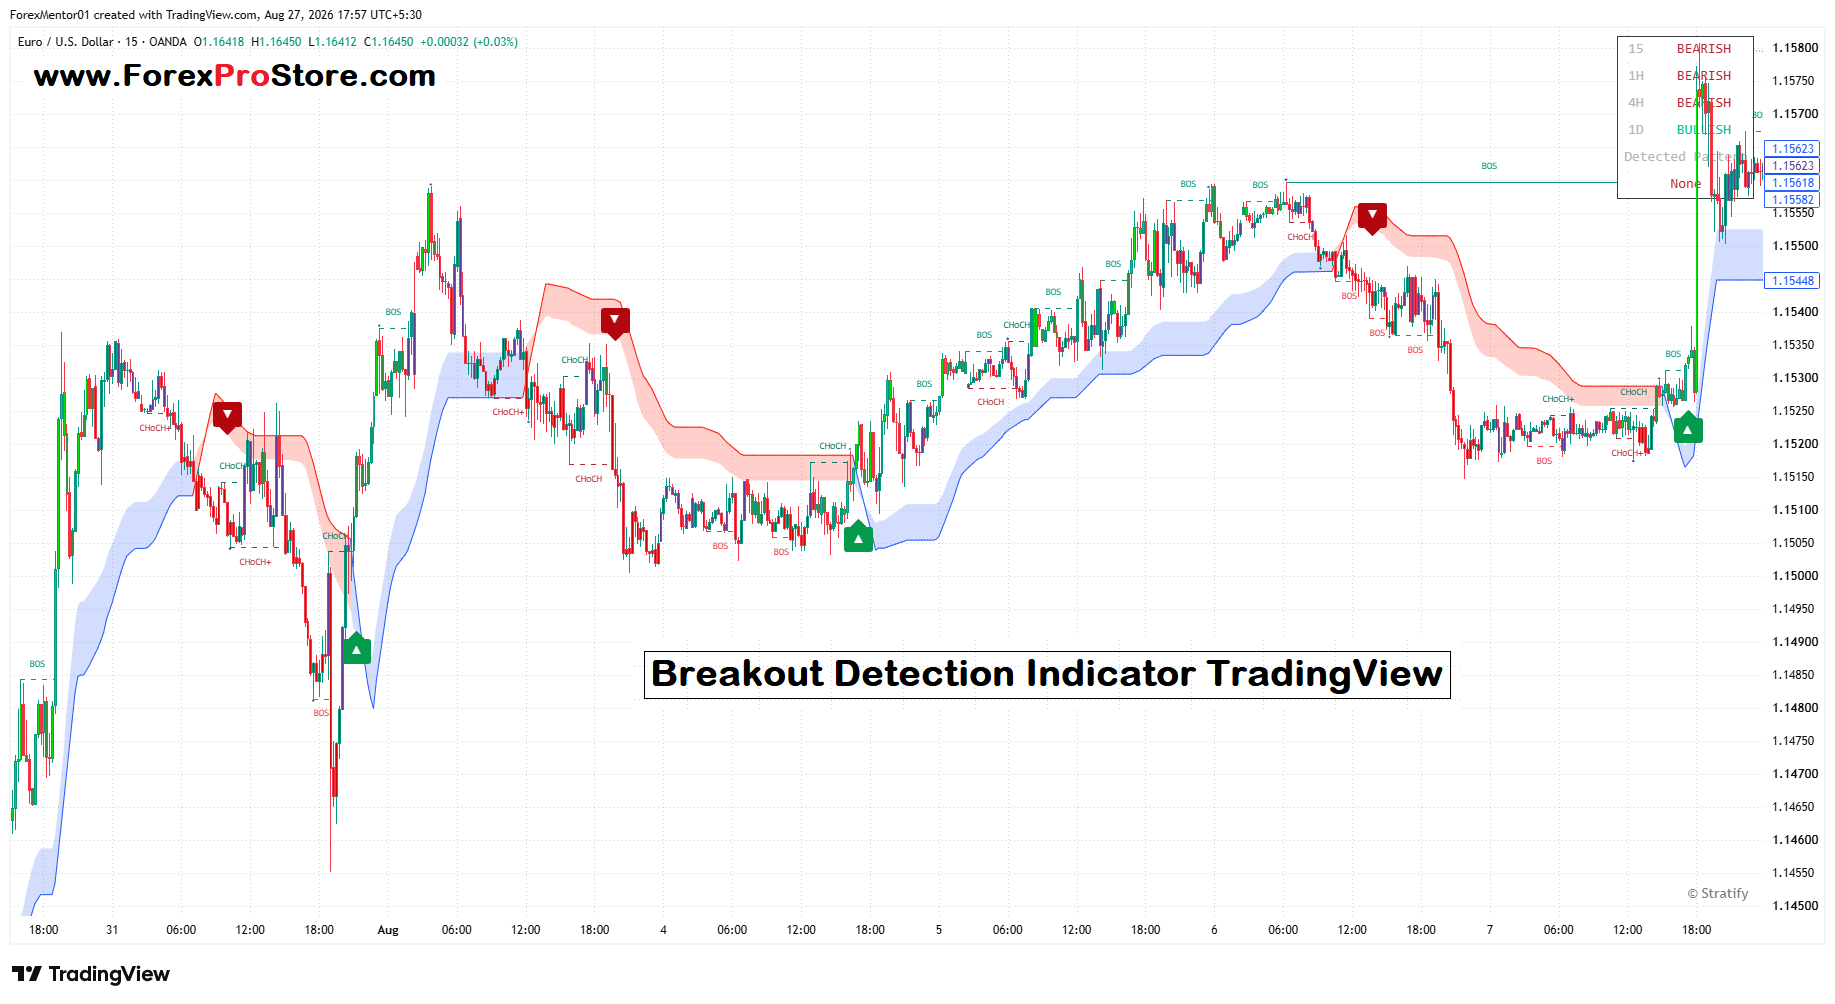
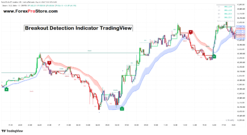
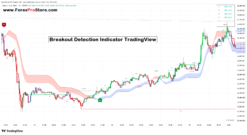
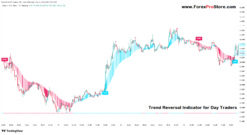
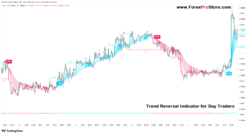
In the screenshot, you can see green and red signals, BOS, CHoCH labels, colored trend bands, and a multi-timeframe trend panel. Each of these features can provide useful information when planning a trade.
How to Use the Indicator
1. Understand the Green and Red Signals
The indicator uses colored signals to highlight possible trading opportunities.
- Green upward signal → possible bullish opportunity.
- Red downward signal → possible bearish opportunity.
A green signal generally becomes more meaningful when price is also moving above the trend band and the overall market structure is bullish.
Similarly, a red signal can be stronger when price is below the trend band and the market structure is bearish.
Do not enter a trade simply because an arrow appears. It is better to wait for confirmation from price action and market structure.
2. Understand BOS – Break of Structure
BOS means Break of Structure.
It occurs when price breaks an important previous swing high or swing low.
For example:
- Price is making higher highs and higher lows.
- Price breaks above a previous important high.
- The indicator marks BOS.
This can indicate that bullish momentum is continuing.
A bearish BOS can occur when price breaks below an important previous low, suggesting increasing selling pressure.
BOS can therefore help you recognize when a trend may be continuing.
3. Understand CHoCH
CHoCH means Change of Character.
It is used to highlight a possible change in market direction.
For example, if the market has been moving downward and price starts breaking an important previous high, the indicator may show CHoCH. This can warn that bearish momentum may be weakening and a bullish move could develop.
Likewise, during an uptrend, a bearish CHoCH can indicate that the market may be changing direction.
4. Use the Colored Trend Bands
The chart also displays blue and red shaded bands.
Generally:
- Blue band → bullish/upward market conditions.
- Red band → bearish/downward market conditions.
When price stays above a rising blue band, traders may look for buying opportunities during pullbacks.
When price remains below a falling red band, traders may look for selling opportunities during retracements.
These bands can also help traders visually identify the current trend without constantly analyzing individual candles.
5. Check the Multi-Timeframe Panel
On the upper-right side of the screenshot, the indicator displays trend information for different timeframes such as:
- 15 minutes
- 1 hour
- 4 hours
- 1 day
If several timeframes show BULLISH, it means the indicator is detecting bullish conditions across multiple timeframes.
For example, if you are trading on a 5-minute chart and the 15-minute, 1-hour, 4-hour, and daily trends are bullish, you may prefer looking for buy setups rather than fighting the larger trend.
The opposite applies when multiple timeframes show bearish conditions.
Example of a Buy Setup
A simple approach could be:
- Wait for the market to show bullish conditions.
- Look for a green signal.
- Confirm that price is above the blue trend band.
- Look for a bullish BOS or CHoCH.
- Check whether higher timeframes support the bullish direction.
- Enter after confirmation rather than entering immediately.
- Place a stop-loss below a logical swing low.
- Set your profit target according to your risk-management plan.
Example of a Sell Setup
For a possible sell:
- Look for bearish market conditions.
- Wait for a red signal.
- Confirm price is below the red trend band.
- Look for bearish BOS or CHoCH.
- Check the higher-timeframe direction.
- Enter after confirmation.
- Place a stop-loss above a logical swing high.
- Use a predefined risk-to-reward target.
Main Benefits
The Breakout Detection Indicator can provide several advantages:
- Easy-to-read chart: Important information is displayed visually.
- Market-structure identification: BOS and CHoCH can help identify structural changes.
- Trend identification: Colored bands make bullish and bearish conditions easier to recognize.
- Multi-timeframe confirmation: You can quickly compare different timeframe conditions.
- Potential entry assistance: Green and red signals can help identify areas worth investigating.
- Better trade filtering: Combining signals with trend and market structure can reduce random entries.
- Useful for beginners: It can simplify concepts that are otherwise difficult to identify manually.
TradingView Indicator Installation Method :-
Step 1 – Copy/Paste Custom Code
Step 2 – Open TradingView and open any chart.
Step 3 – At the bottom of the chart, click Pine Editor.
Step 4 – Click Open → New blank indicator (or New indicator).
Step 5 – Delete the existing code.
Step 6 – Paste your custom Pine Script code.
Step 7 – Click Save and give the indicator a name.
Step 8 – Click Add to chart.
All Done – Your custom indicator will now appear on the chart
Our Payment Options:👇
1) Bitcoin Wallet:
14vtHib35eUirhcXiKRUqUs7Ejcy51gFNu
2) USDT(Tether) Wallet: (ERC20)
0x254b7bdbea655bfaf428ffd8010945b04a369114
3) TRX(Tron) Wallet: (TRC20)
TJPTi6GtfAs2P2mJaAYsR4LhdKpvsa5KE3
4) XRP(Ripple): Tag(370508805)
rNxp4h8apvRis6mJf9Sh8C6iRxfrDWN7AV
And another crypto wallet: on request
5) Visa/Master Card Via Payment Link: On Request
6) Western Union: On Request
7) This Website(www.ForexProStore.com). You can purchase directly from website by Your Credit/Debit Cards and All crypto currencies and Instant Download Indicator Files.
Send payment screenshot to: 👇🏿
Payment After we will provide product within 30 minutes.
If you want any proofs of Indicator or have any questions then feel free to message
WhatsApp: Click Here
Telegram: Click Here
Mail Us: Click Here
Thank You ❤️
Related products
TradingView Indicators
TradingView Indicators
TradingView Indicators
TradingView Indicators
TradingView Indicators
TradingView Indicators
TradingView Indicators
TradingView Indicators