
Automatic Buy Sell Signal Generator
Original price was: $3,000.00.$400.00Current price is: $400.00.
⭐ Indicator Features
- ✅ Original & Reliable Indicator
- ⏰ 24/7 Trading — Use Anytime
- ⚡ Instant ZIP Download
- ⏱️ Timeframes: M1 to W1
- 💻 Works on Mobile, Tablet & PC
- ♾️ Unlimited TradingView Accounts
- 📊 Scalping & Intraday Strategy
- 📝 Pine Script Source Code Included
- 🌍 Works on Forex, Crypto & Stocks
- 🛠️ Customer Support & Free Updates
- 💎 One-Time Payment • Lifetime Use
📊 How to Use the Automatic Buy Sell Signal Generator
The Automatic Buy Sell Signal Generator is a TradingView indicator designed to make chart analysis easier by showing potential Buy and Sell signals directly on the chart. It can be useful for traders who want a simple visual way to identify possible market direction without studying many indicators at the same time.
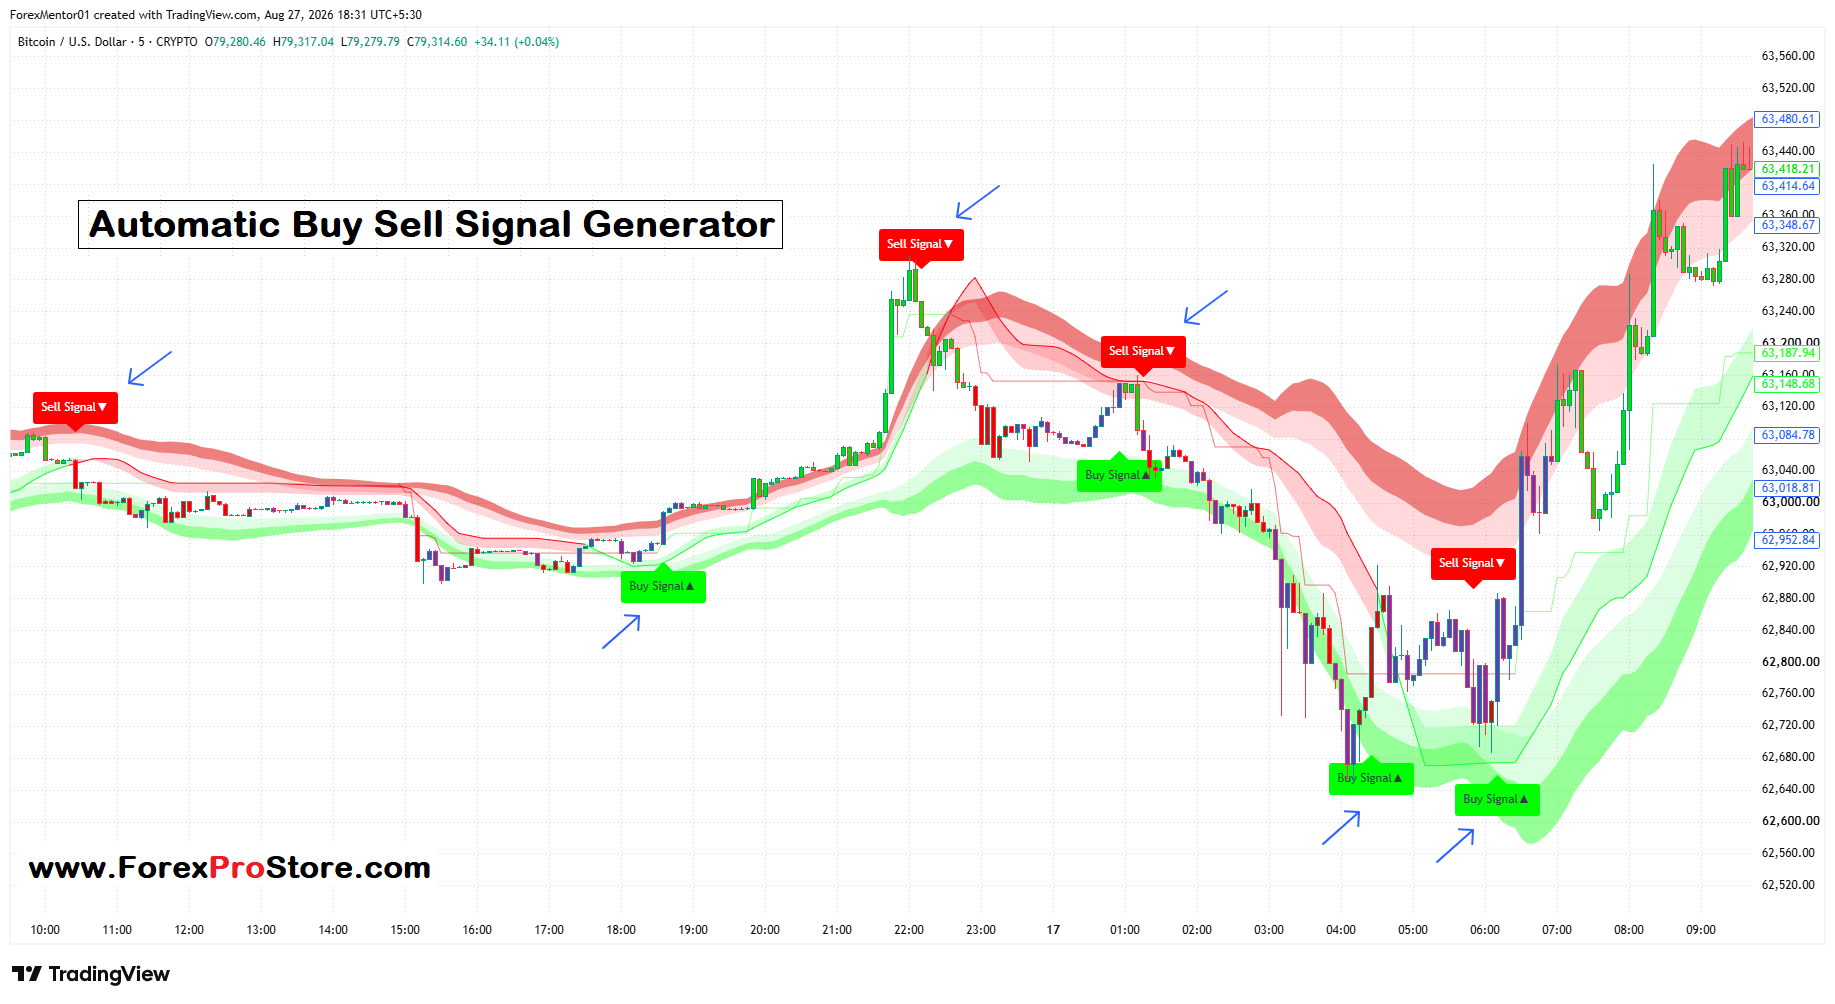
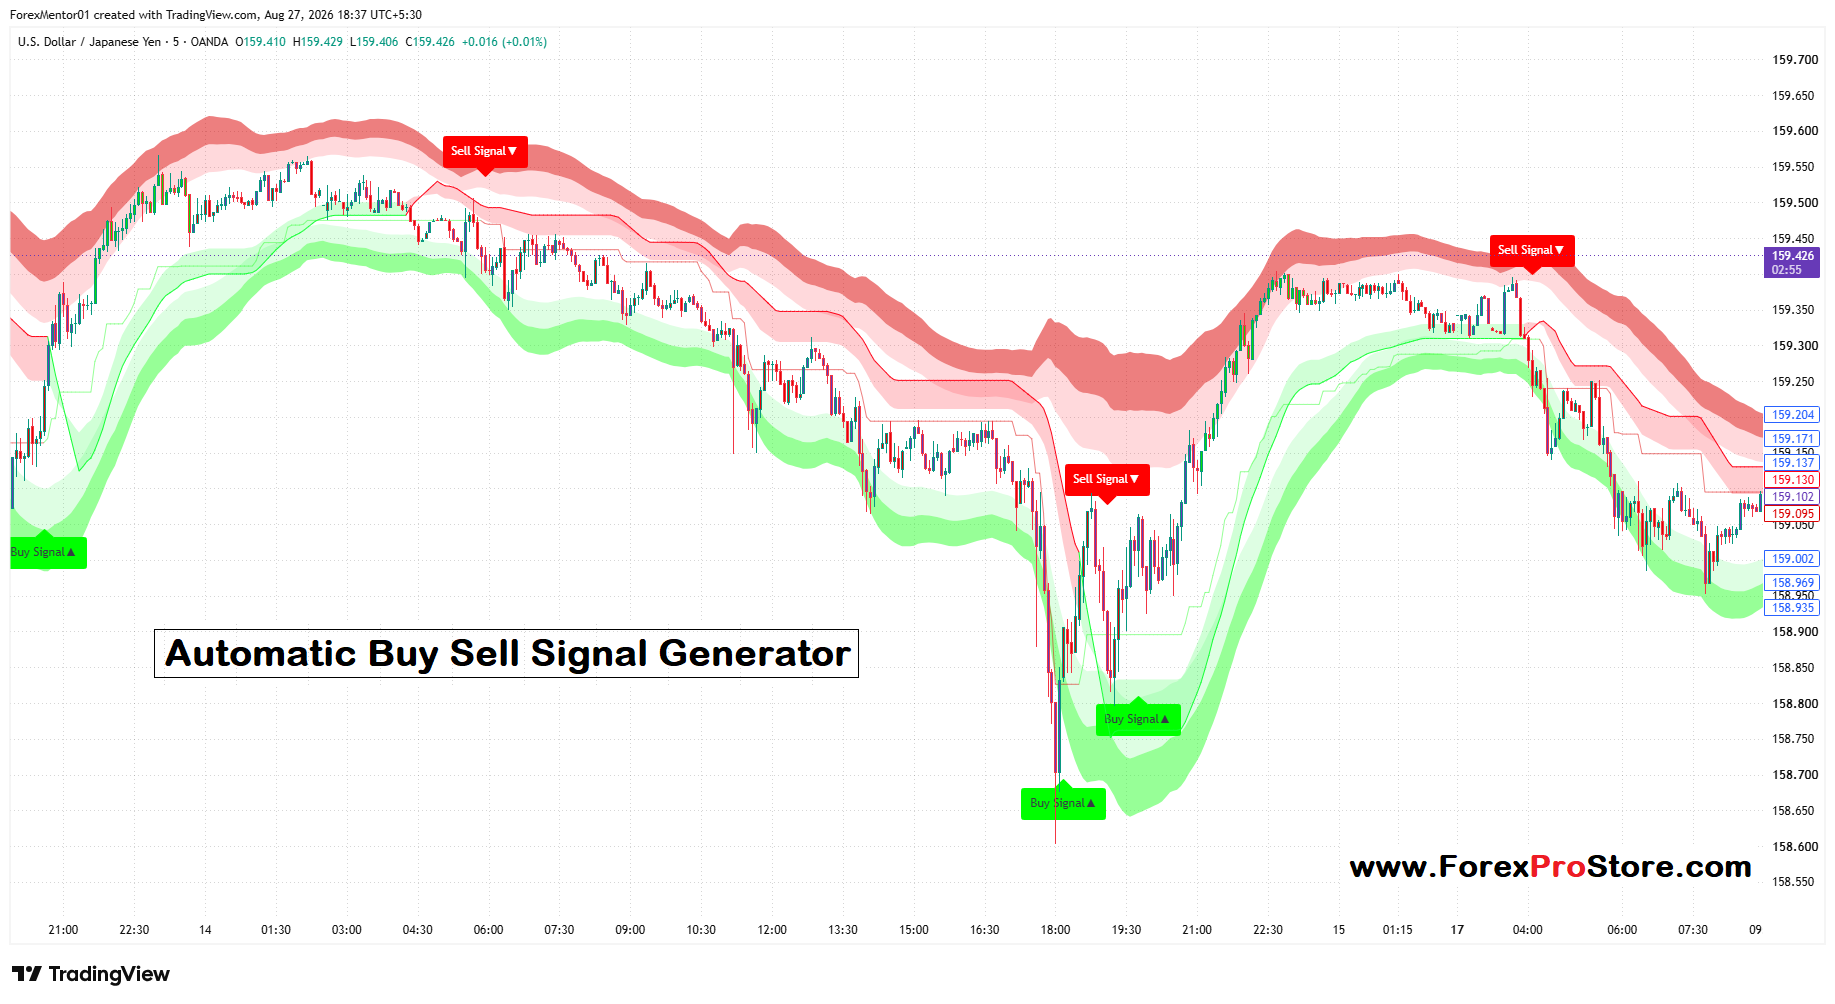
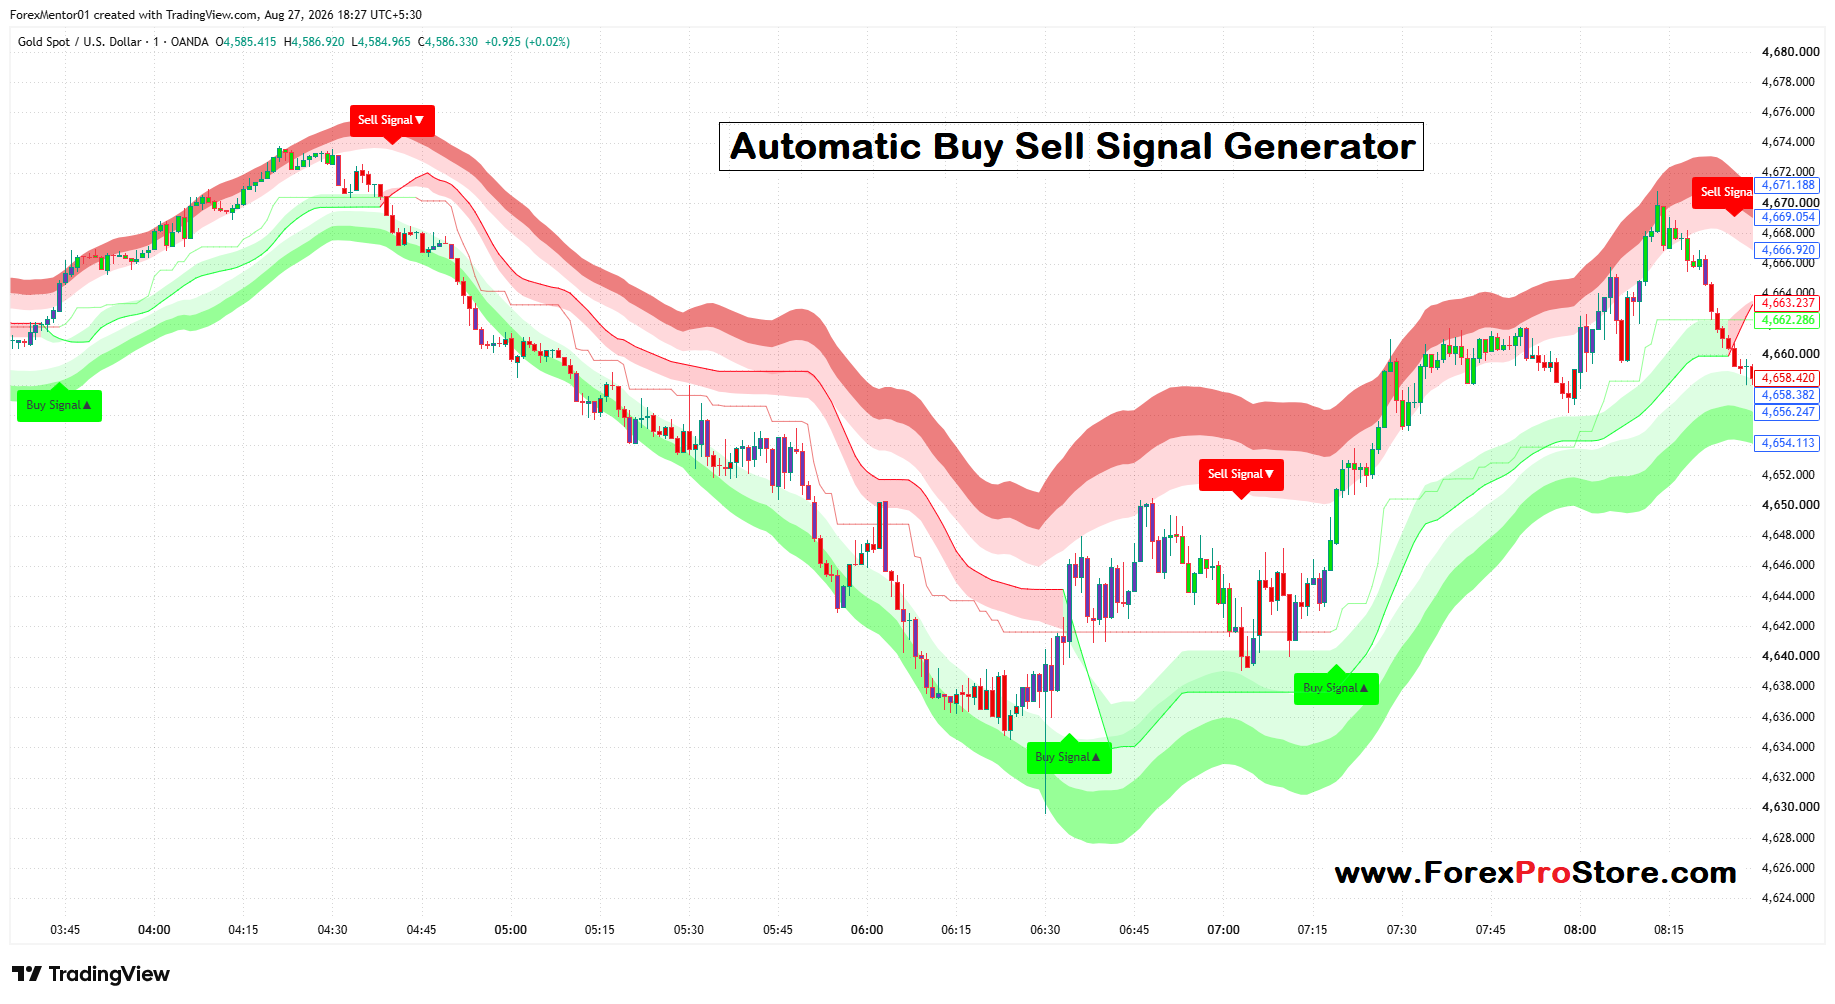
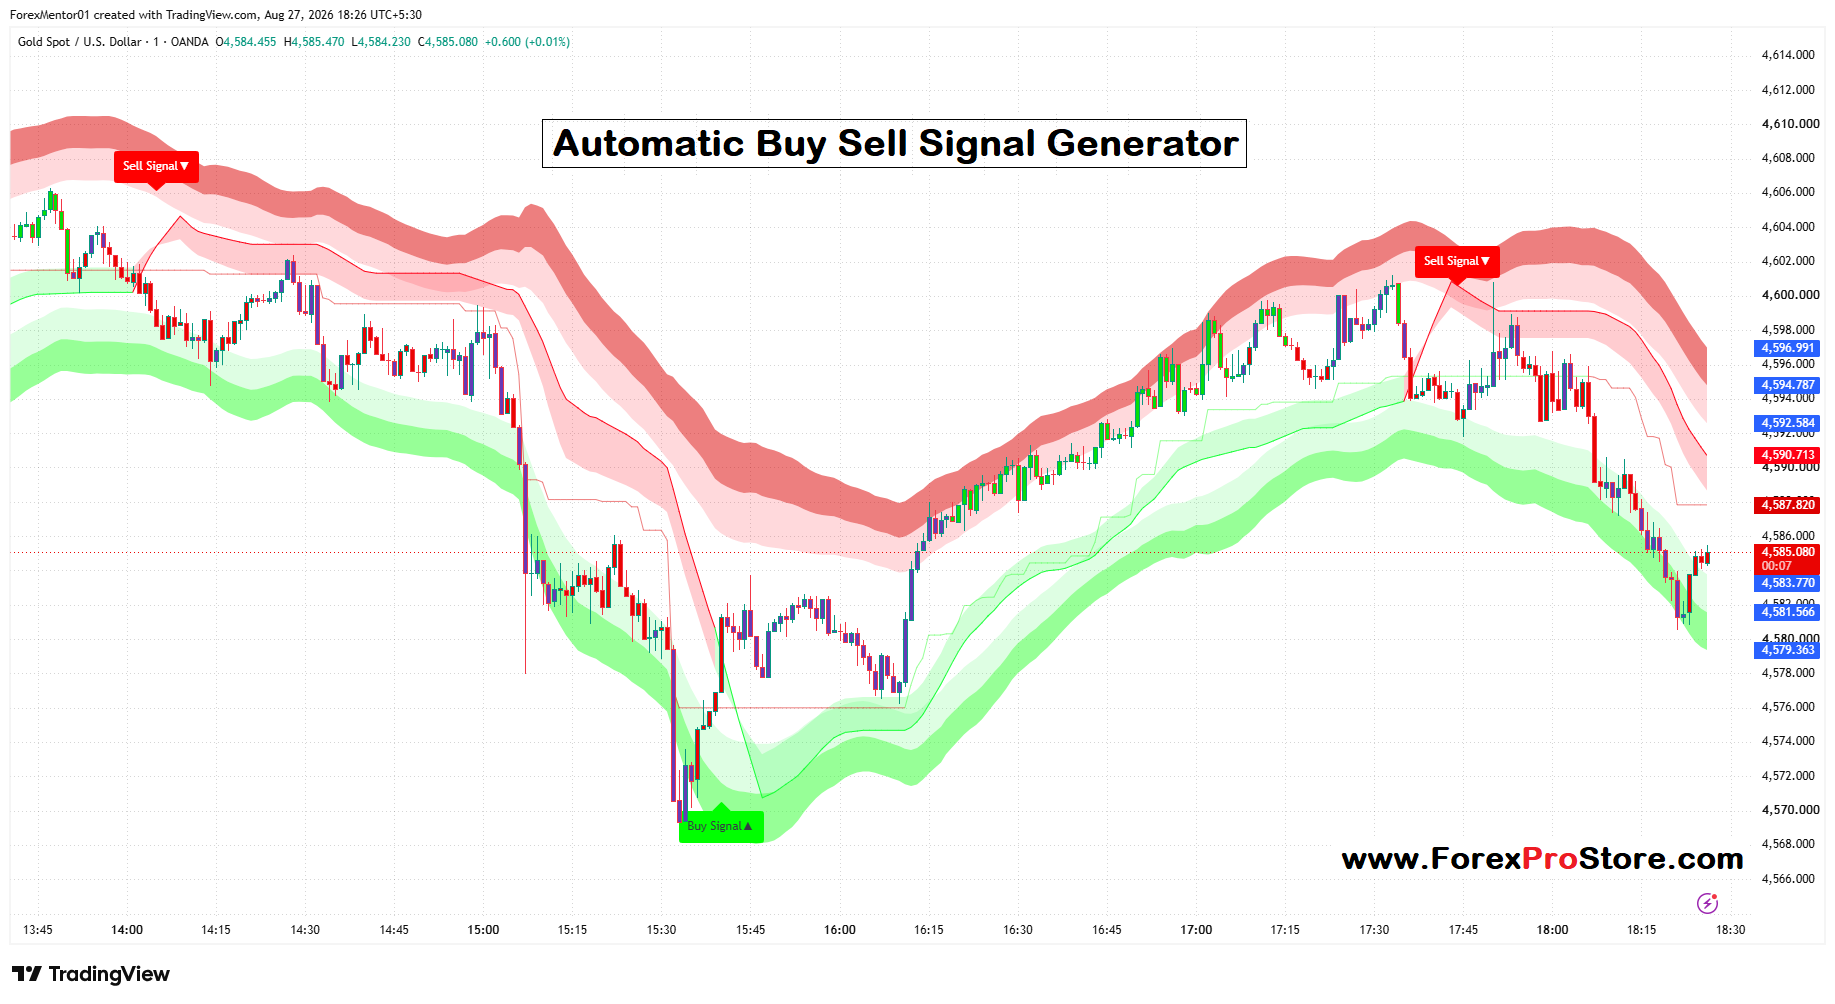
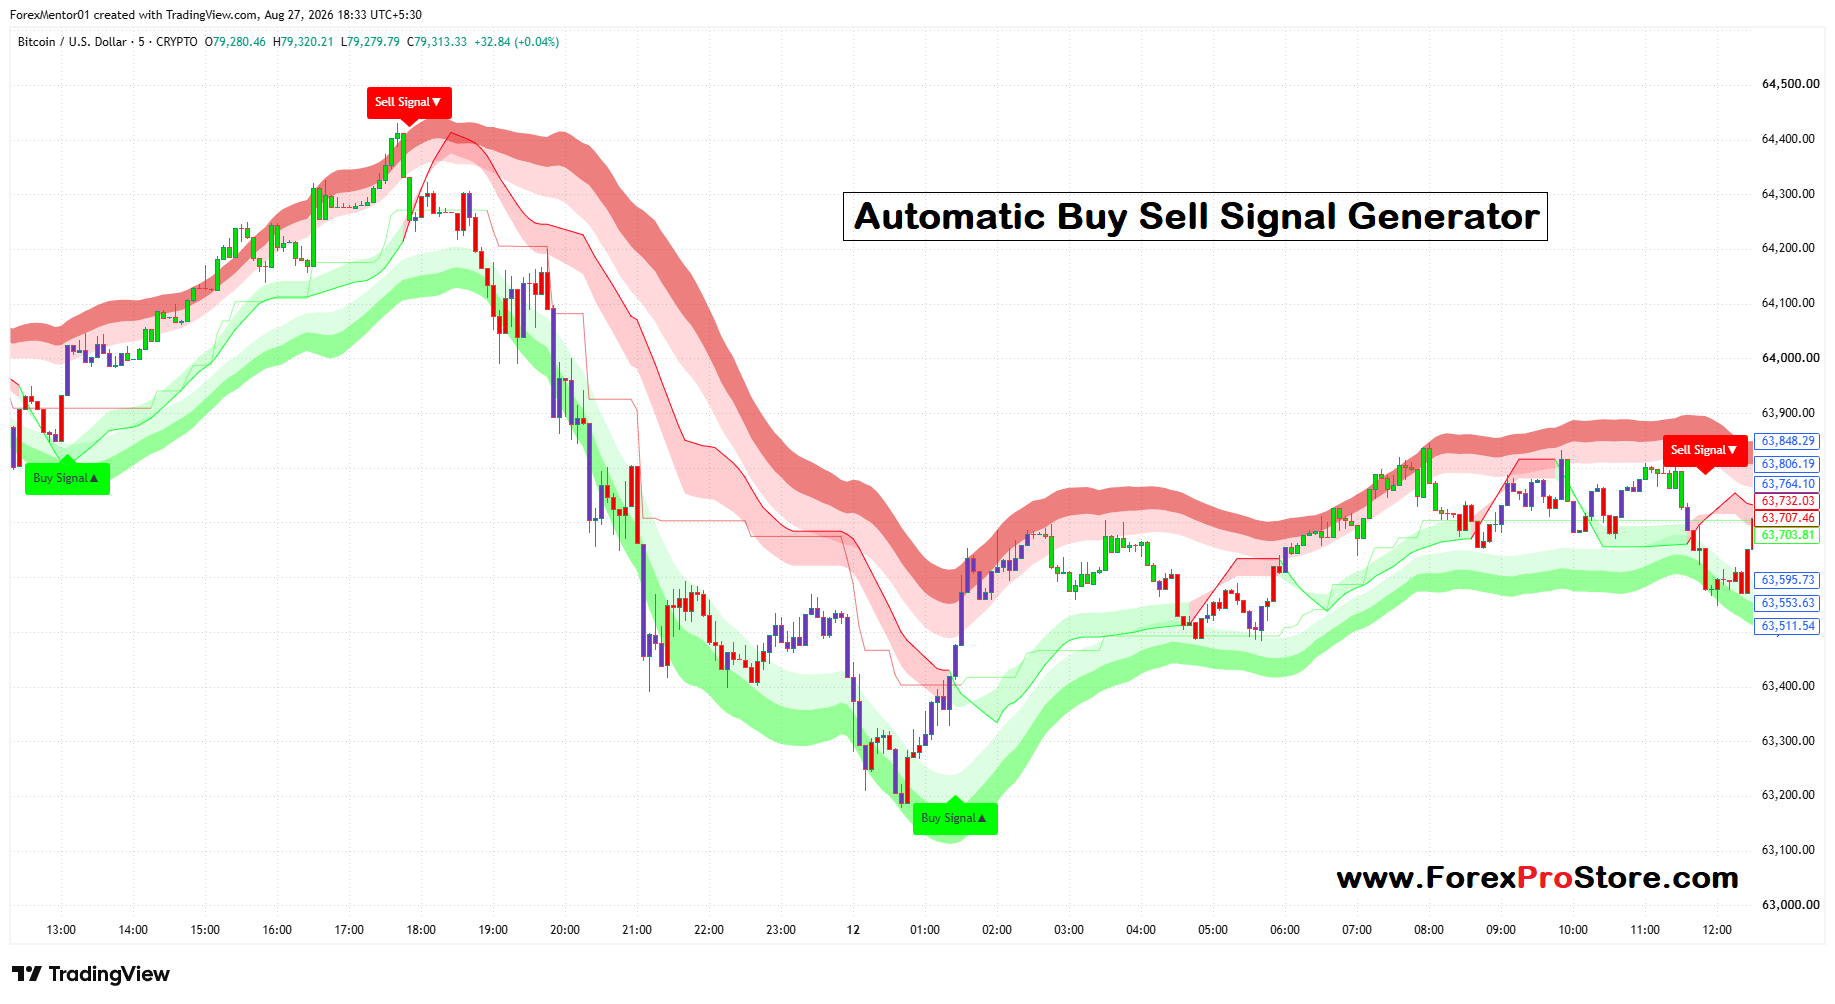
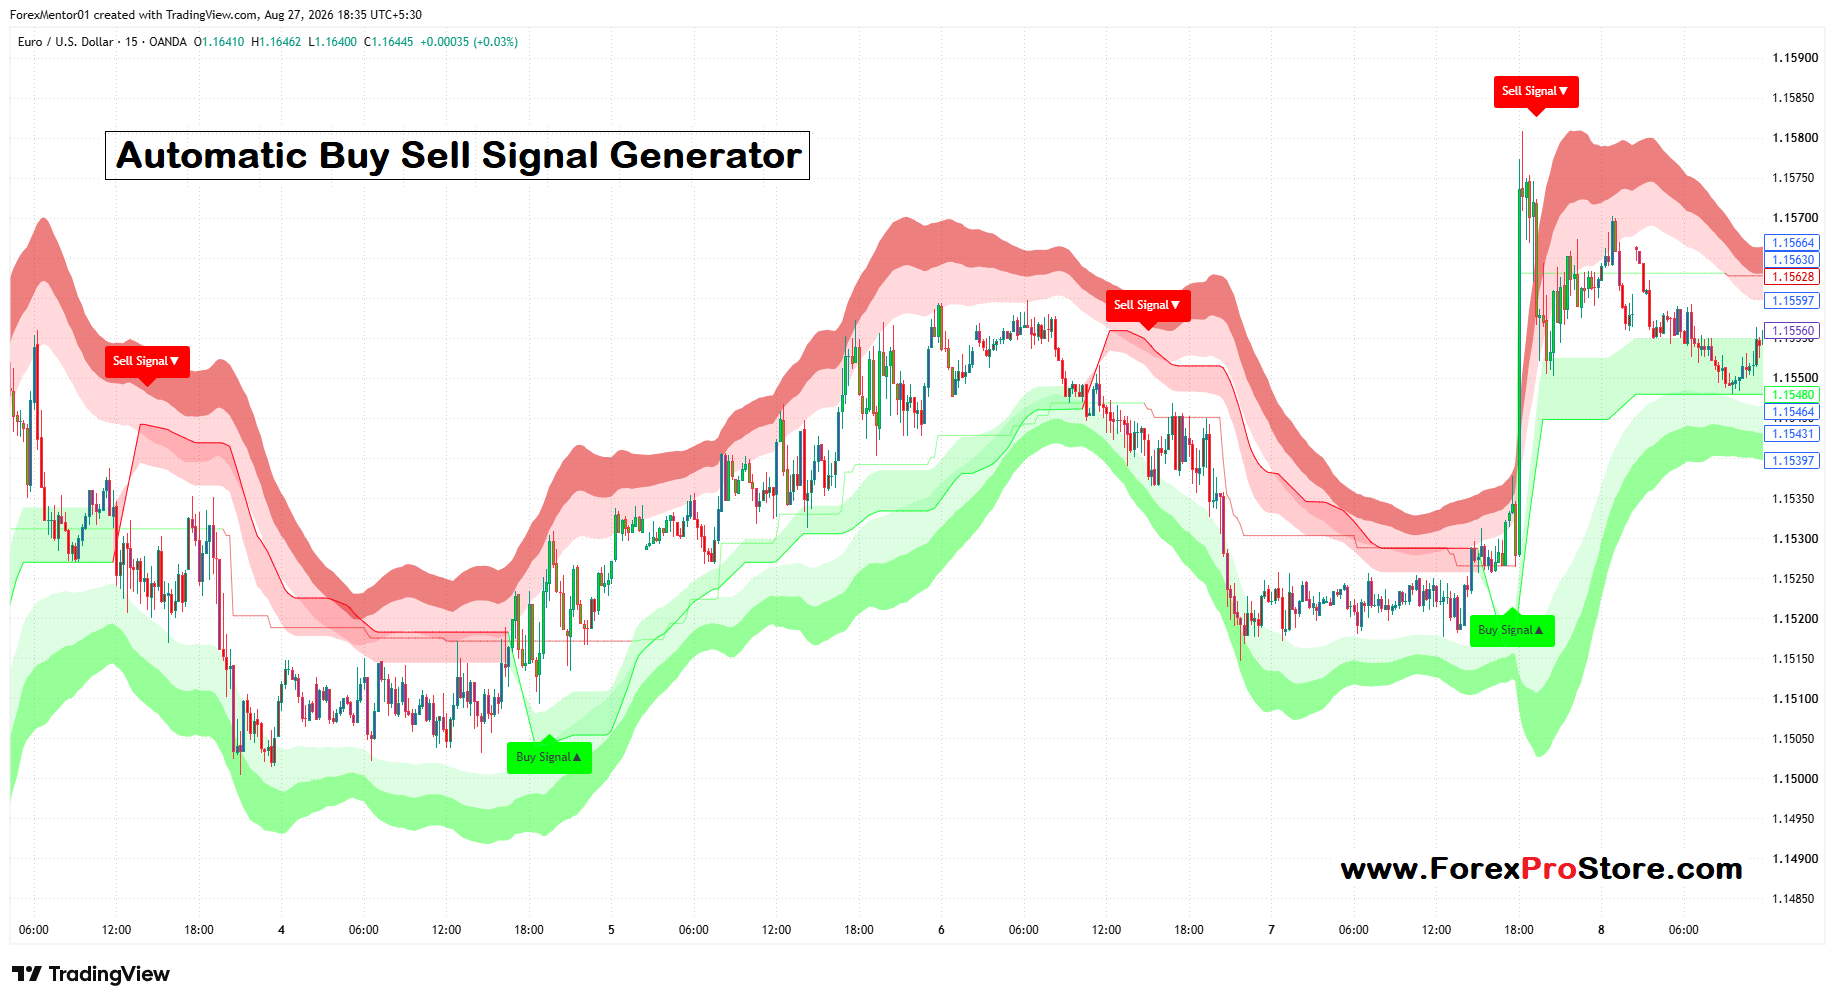
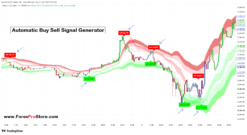
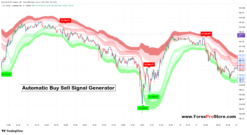
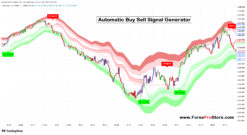
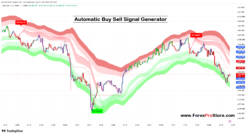
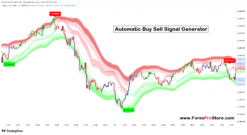
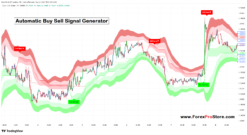
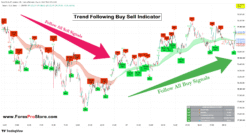
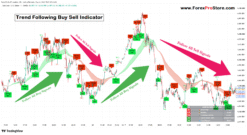
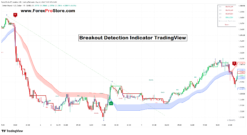
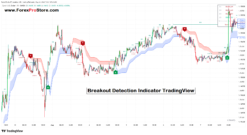
The indicator shown in the image uses Buy Signal ▲ and Sell Signal ▼ labels along with colored market zones.
🟢 How to Use Buy Signals
When the indicator displays a green “Buy Signal ▲”, it suggests that the market may be entering a potential bullish or upward-moving area.
For example, in the chart, a Buy Signal appears around the market’s lower area after a strong decline. This can indicate that the selling pressure may be weakening and that a possible upward move is developing.
A simple approach is:
Buy Signal → Check the candle → Confirm the market direction → Consider an entry.
You can look for additional confirmation such as:
- Price beginning to make higher highs and higher lows
- Strong bullish candles after the signal
- Price moving above an important support/resistance level
- Confirmation from a higher timeframe
Avoid entering simply because a Buy Signal appears. Waiting for confirmation can help reduce unnecessary trades.
🔴 How to Use Sell Signals
When the indicator displays a red “Sell Signal ▼”, it suggests that the market may be entering a potential bearish or downward-moving area.
In the image, Sell Signals appear near areas where price has moved upward and then starts showing weakness. A trader could use the signal as an alert to look for a possible short-selling opportunity or to consider protecting an existing long position.
A basic process is:
Sell Signal → Check the candle → Confirm weakness → Consider an entry.
You can look for bearish candles, lower highs, breaks of support, or confirmation from a higher timeframe.
🟥🟩 Understanding the Colored Zones
One of the most useful visual features is the colored band or zone surrounding the price.
The green zones generally represent a bullish/supportive area. When price is moving around or above the green area, it can suggest that buyers have more strength.
The red zones generally represent a bearish/resistance area. When price moves into or below these areas, it can suggest increased selling pressure.
These zones can help you understand the market trend instead of looking only at Buy and Sell labels.
⏱️ Useful for Different Trading Styles
This type of indicator can be used for scalping and intraday trading, depending on the timeframe and strategy.
For faster trading, you might study smaller timeframes such as 1-minute, 5-minute, or 15-minute charts. For a broader market view, higher timeframes can help identify the overall trend.
A useful method is to check a higher timeframe first and then use a lower timeframe for a possible entry.
💡 Main Benefits
1. Easy-to-Read Signals
Buy and Sell labels make the chart easier to understand, especially for traders who don’t want a complicated setup.
2. Visual Trend Identification
The colored bands provide a quick visual representation of possible bullish and bearish areas.
3. Saves Analysis Time
Instead of checking many indicators separately, you can use the signals and zones as a starting point for your analysis.
4. Helps Find Potential Entry Areas
The signals can draw your attention to areas where the market may be changing direction.
5. Useful for Beginners
The straightforward visual design makes it easier for new traders to learn how market movements and potential signals work.
✅ Simple Trading Flow
Check Trend → Wait for Signal → Confirm Price Action → Enter Trade → Set Stop Loss → Set Target → Manage Risk
Used correctly, the Automatic Buy Sell Signal Generator can make your TradingView chart cleaner, easier to read, and faster to analyze, while helping you focus on potential trading opportunities rather than constantly searching for market direction.
TradingView Indicator Installation Method :-
Step 1 – Copy/Paste Custom Code
Step 2 – Open TradingView and open any chart.
Step 3 – At the bottom of the chart, click Pine Editor.
Step 4 – Click Open → New blank indicator (or New indicator).
Step 5 – Delete the existing code.
Step 6 – Paste your custom Pine Script code.
Step 7 – Click Save and give the indicator a name.
Step 8 – Click Add to chart.
All Done – Your custom indicator will now appear on the chart
Our Payment Options:👇
1) Bitcoin Wallet:
14vtHib35eUirhcXiKRUqUs7Ejcy51gFNu
2) USDT(Tether) Wallet: (ERC20)
0x254b7bdbea655bfaf428ffd8010945b04a369114
3) TRX(Tron) Wallet: (TRC20)
TJPTi6GtfAs2P2mJaAYsR4LhdKpvsa5KE3
4) XRP(Ripple): Tag(370508805)
rNxp4h8apvRis6mJf9Sh8C6iRxfrDWN7AV
And another crypto wallet: on request
5) Visa/Master Card Via Payment Link: On Request
6) Western Union: On Request
7) This Website(www.ForexProStore.com). You can purchase directly from website by Your Credit/Debit Cards and All crypto currencies and Instant Download Indicator Files.
Send payment screenshot to: 👇🏿
Payment After we will provide product within 30 minutes.
If you want any proofs of Indicator or have any questions then feel free to message
WhatsApp: Click Here
Telegram: Click Here
Mail Us: Click Here
Thank You ❤️
Related products
TradingView Indicators
TradingView Indicators
TradingView Indicators
TradingView Indicators
TradingView Indicators
TradingView Indicators
TradingView Indicators
TradingView Indicators