
M1 Scalping Indicator for TradingView
Original price was: $2,000.00.$450.00Current price is: $450.00.
- Original Indicator
- Trading time: Every time
- Instant Download in Zip file
- Working Timeframe: M1 to W1
- Use on Unlimited Tradingview Accounts
- Type of strategy: Scalping and Intraday
- Source Code:- Pine script
- Works on All pairs Forex, Crypto, Stock Marke etc.
- Customer Support & Free Upgrades
- Lifetime Version
M1 Scalping Indicator for TradingView – How to Use It and Its Benefits
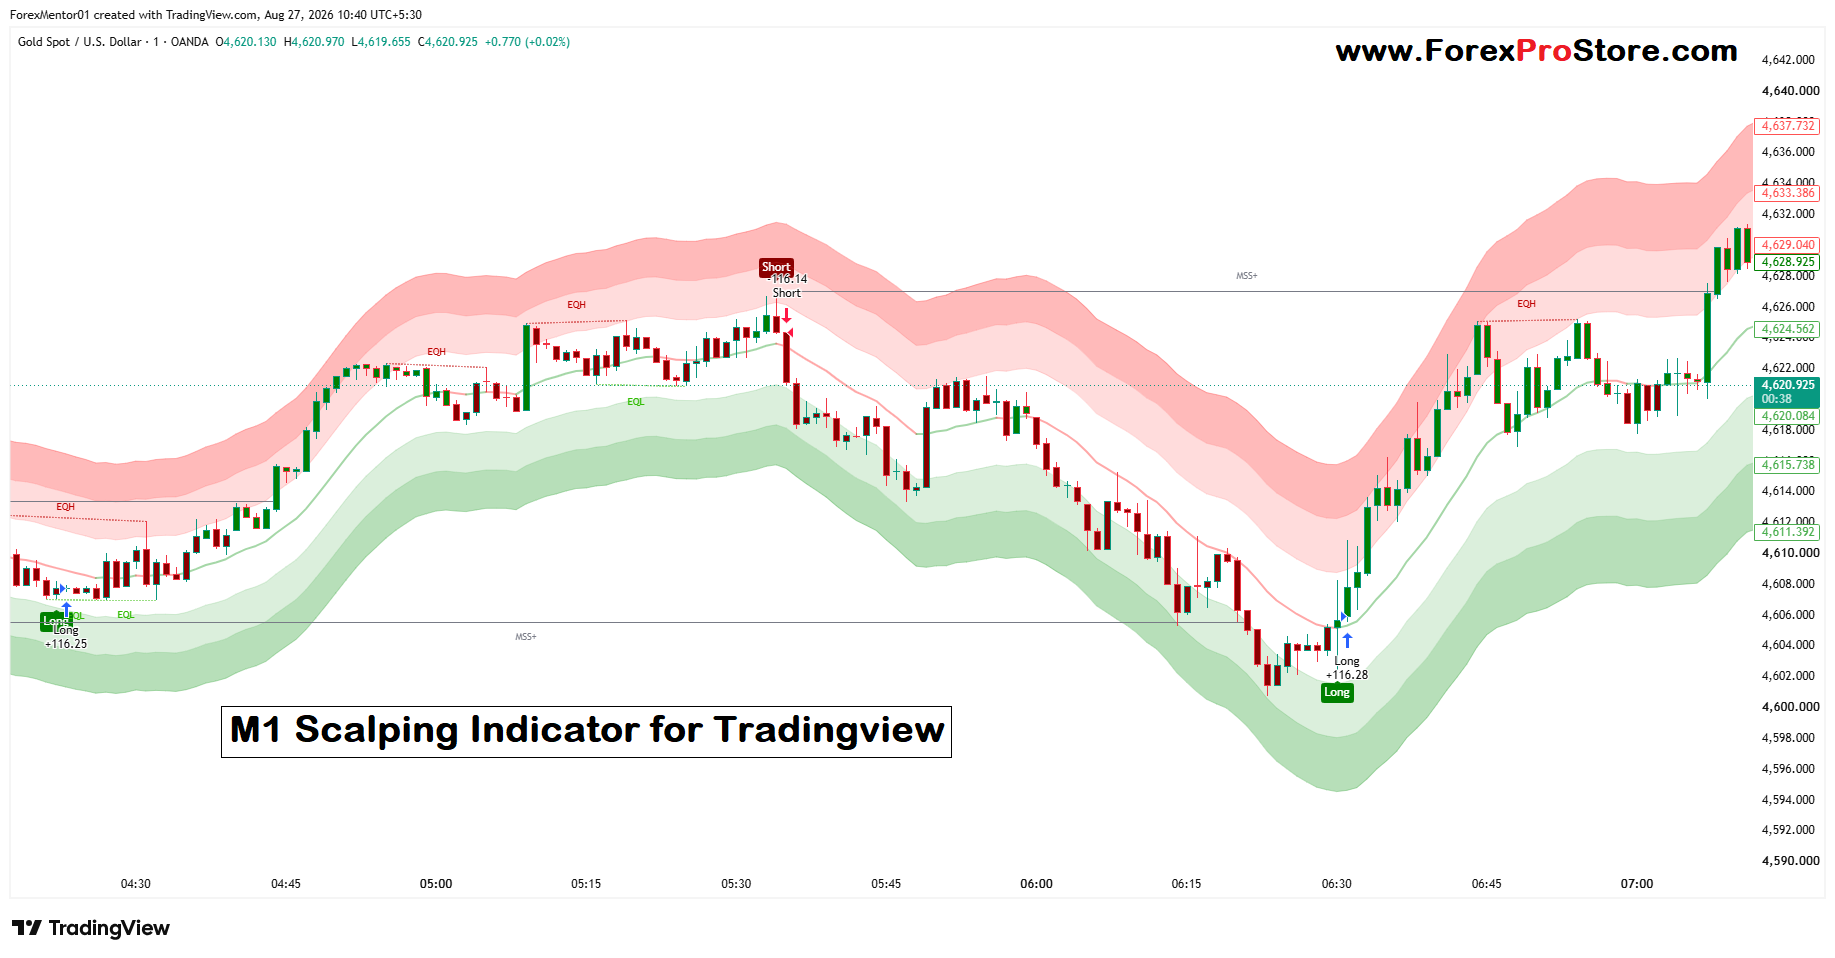
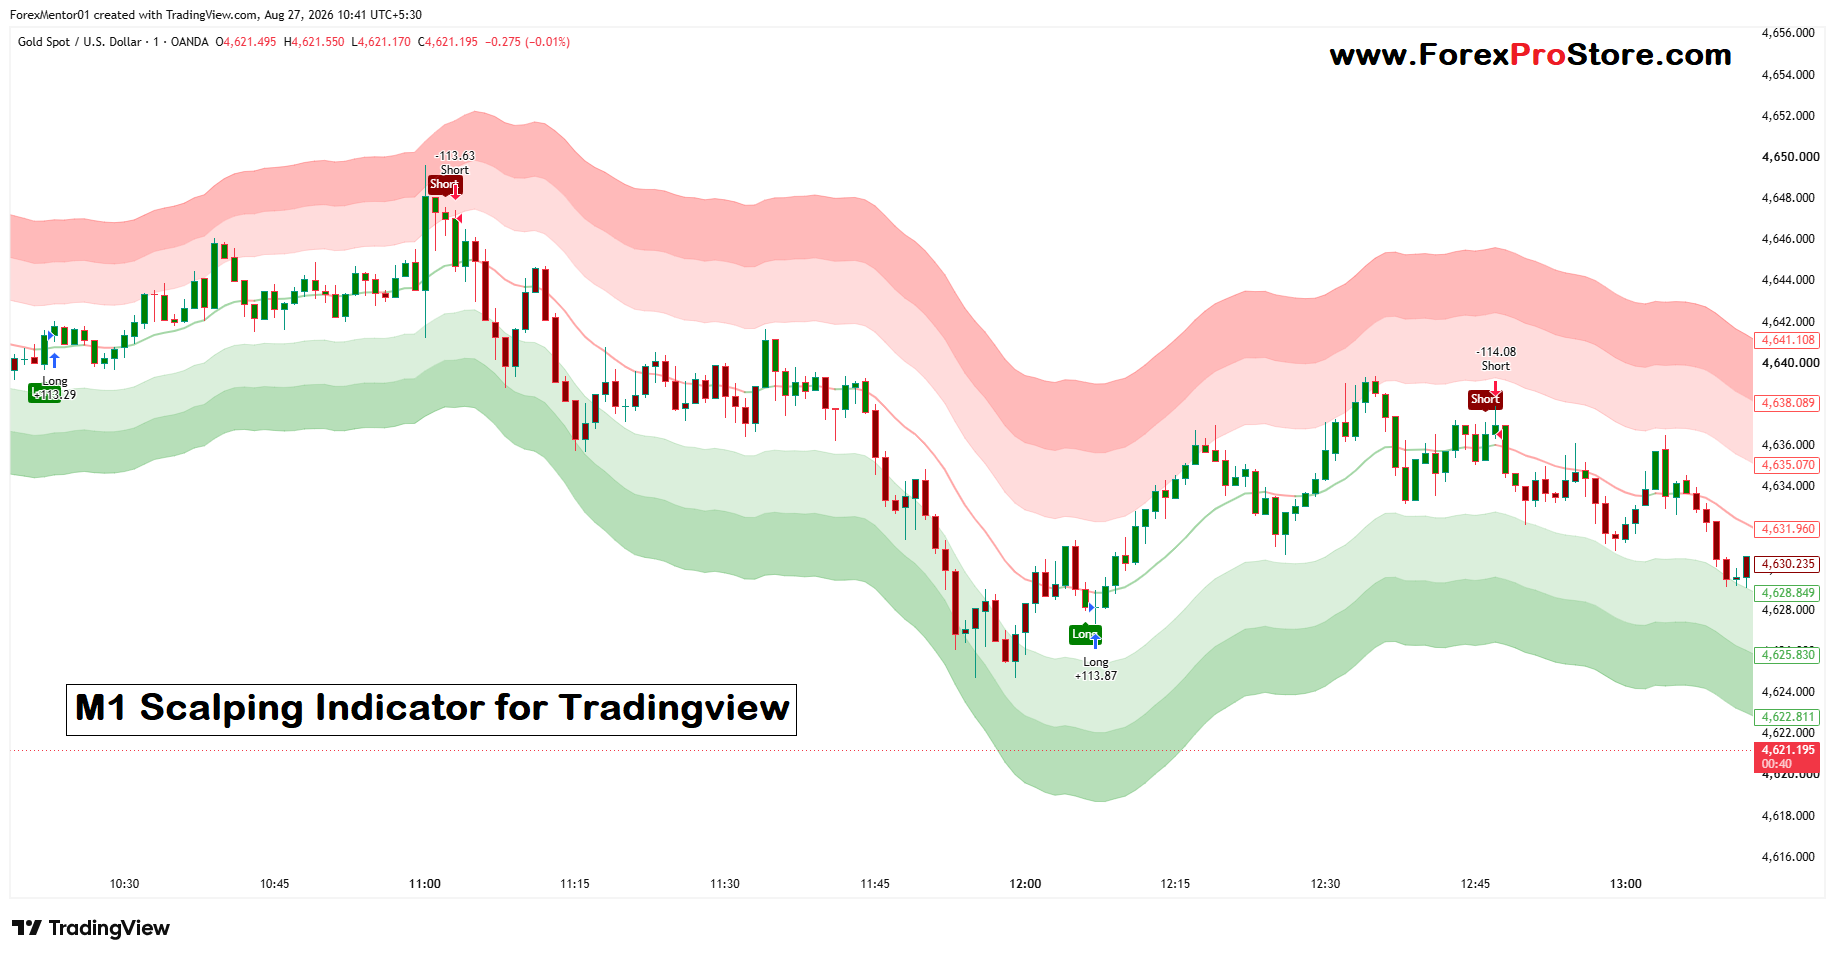
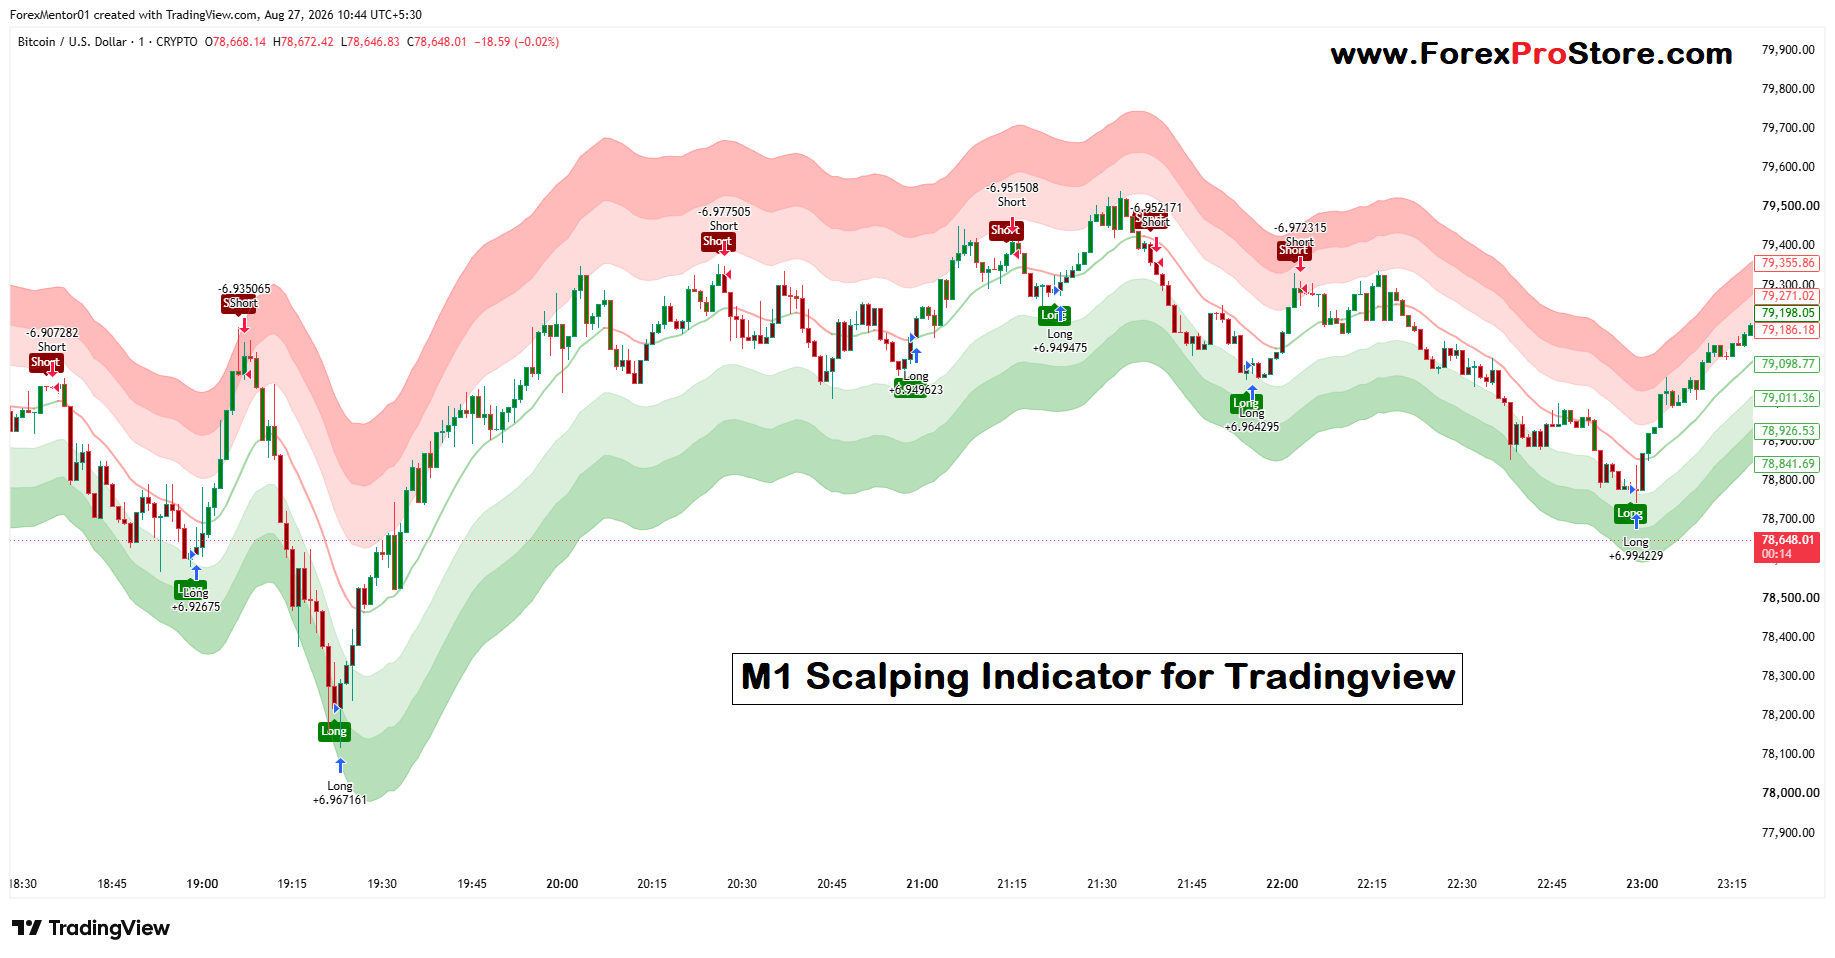
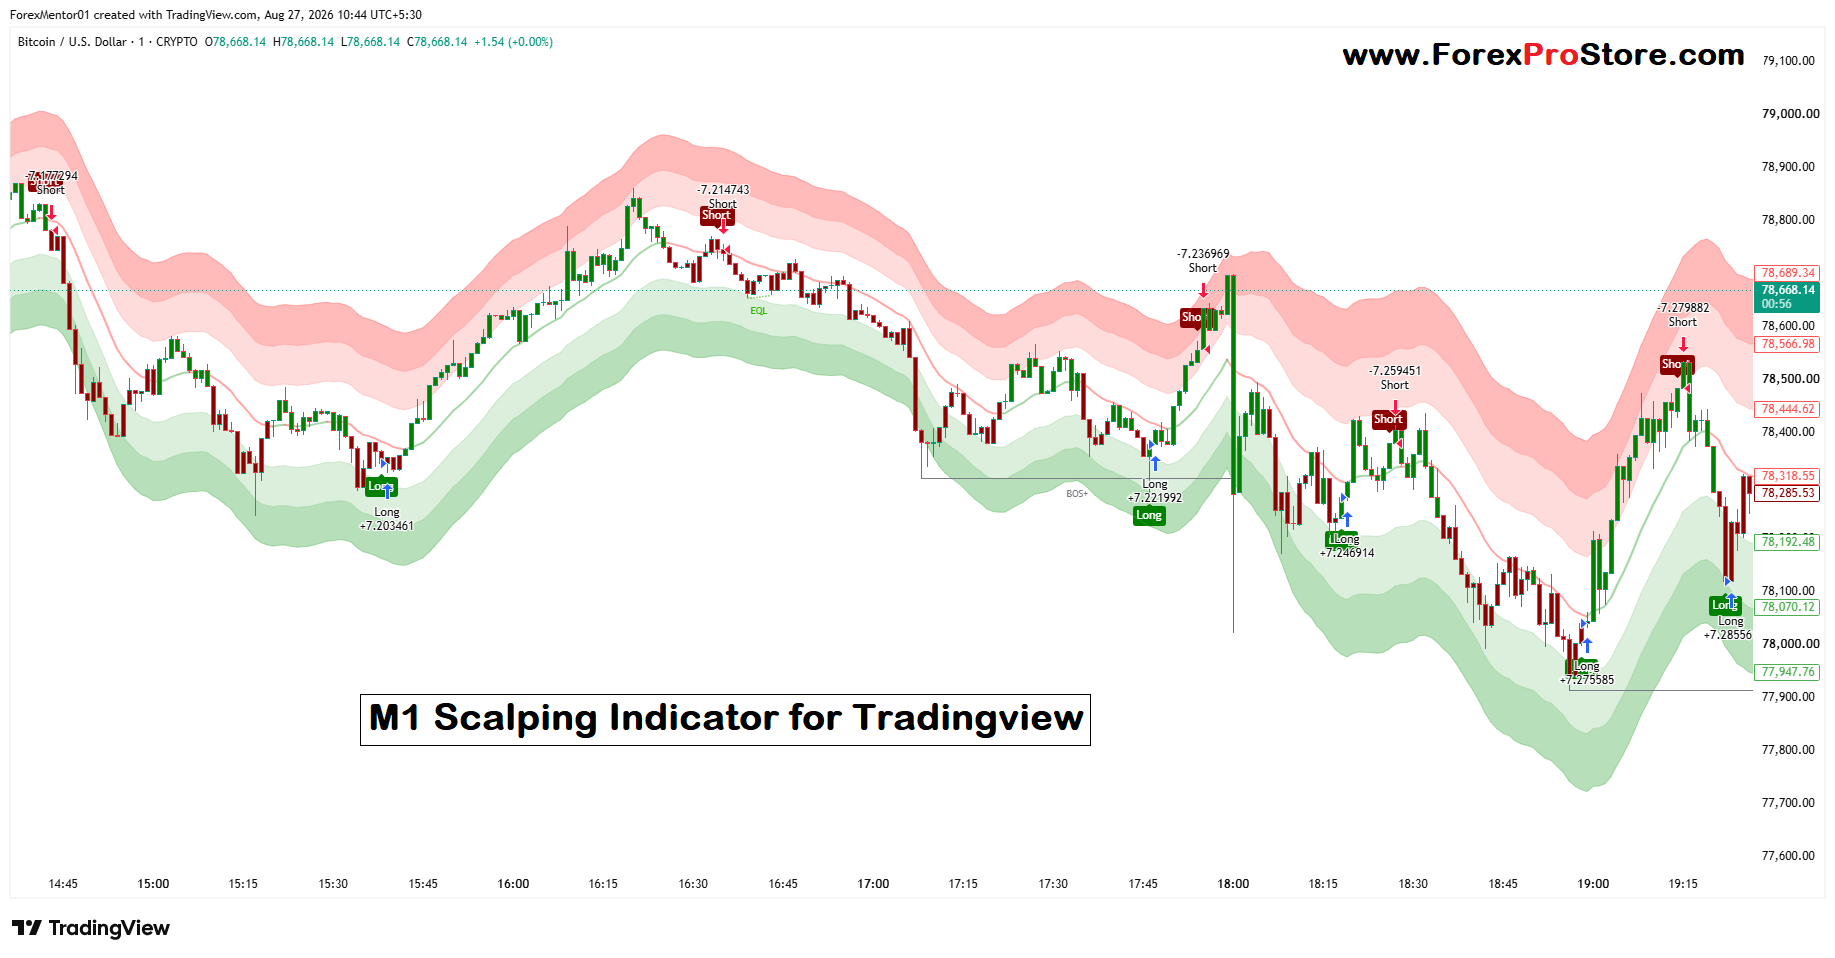
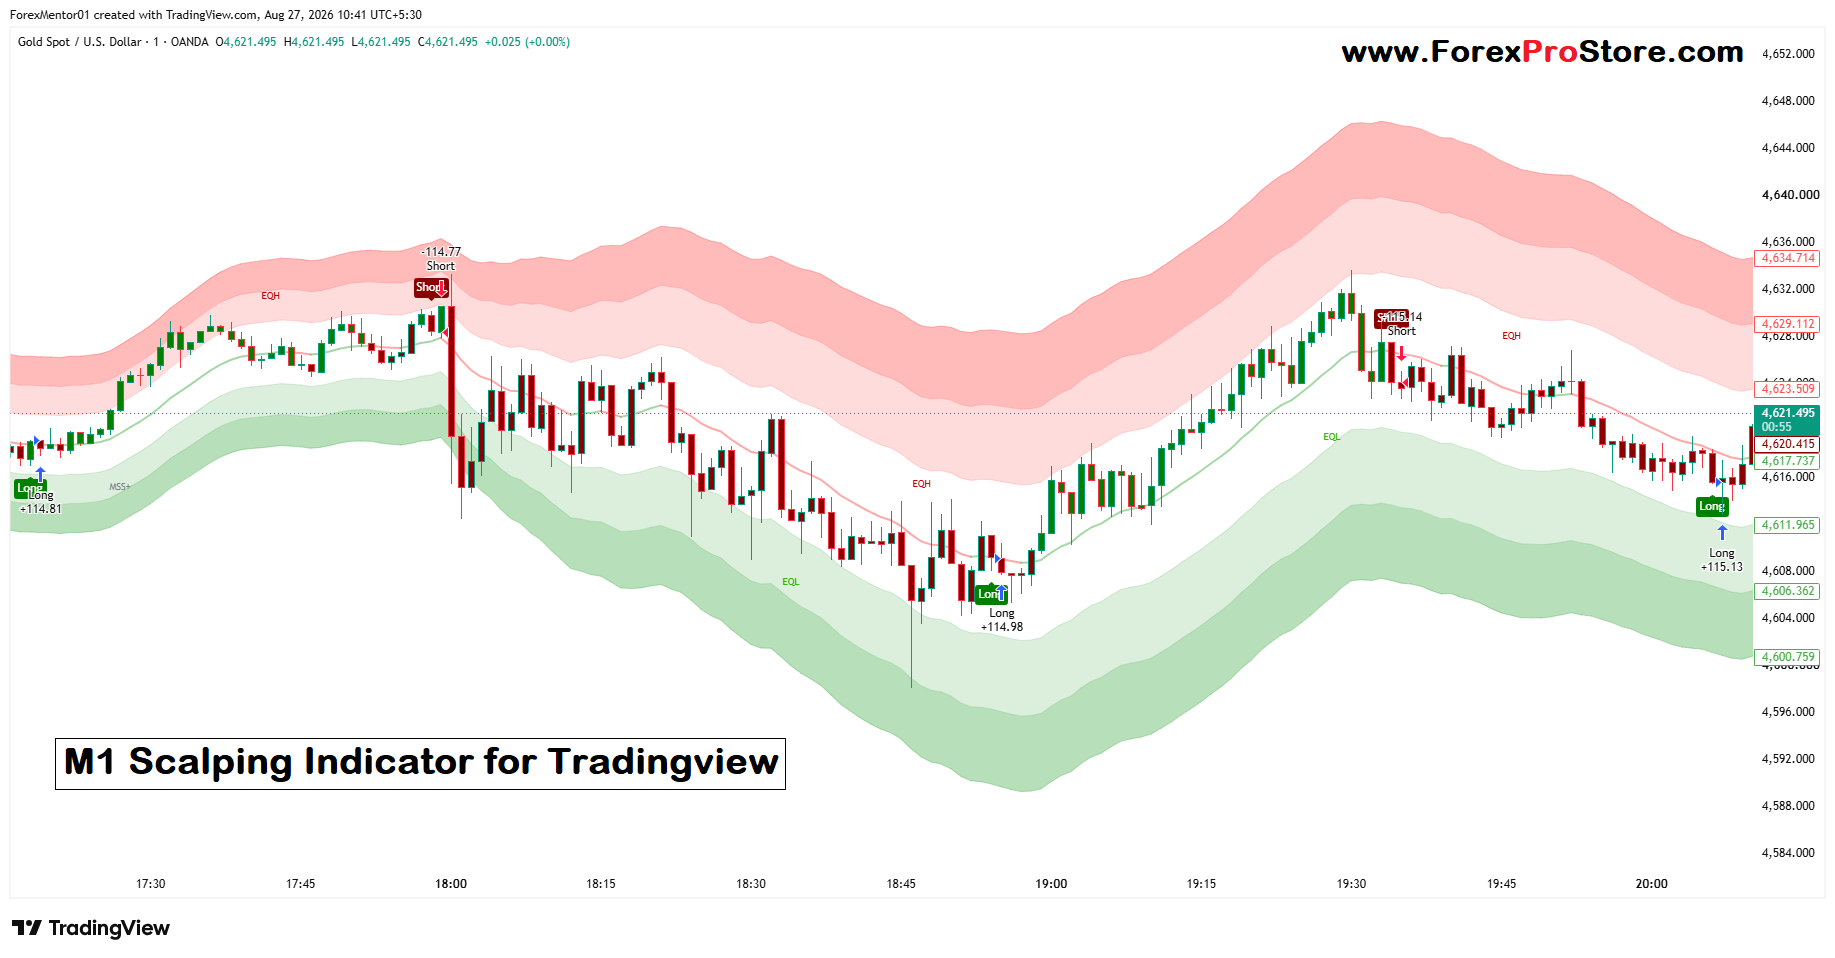
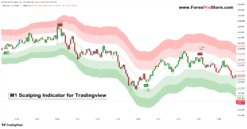
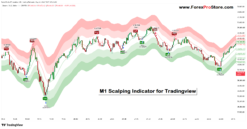
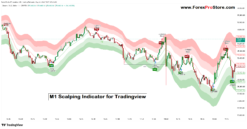
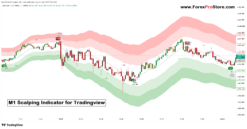
The M1 Scalping Indicator shown in the image is designed mainly for short-term trading and scalping, especially on the 1-minute (M1) chart. It provides visual signals such as Long, Short, support/resistance areas, market-structure information, and colored bands around price. These features can help traders identify possible buying and selling opportunities more easily.
1. What Do the Colored Bands Mean?
The indicator displays green and red/pink zones around the price.
- Green zone: Generally represents an area where bullish conditions or potential buying interest may be present.
- Red/pink zone: Generally represents an area where bearish conditions or potential selling pressure may be present.
- The middle lines can help you understand the current trend and possible dynamic support/resistance.
When price is moving strongly upward and remains above the middle/green area, buyers are generally stronger. When price moves downward and remains below the middle area, sellers may be stronger.
Do not buy or sell simply because price touches a colored band. Wait for confirmation.
2. How to Use the Long Signal
In the image, you can see “Long” signals marked with green labels.
A Long signal means the indicator is identifying a possible buying opportunity.
A simple approach is:
- Open the 1-minute chart.
- Wait for a Long signal.
- Check whether price is showing bullish movement.
- Look for price to move back toward or above the indicator’s middle line/green zone.
- Enter a buy trade after confirmation.
- Place your Stop Loss below a recent swing low or another logical support level.
- Take profit at a nearby resistance level or according to your risk/reward plan.
For example, if the indicator gives a Long signal after price has fallen into the lower green area and candles begin moving upward, this can be a stronger setup than blindly buying in the middle of a sideways market.
3. How to Use the Short Signal
The Short label represents a possible selling opportunity.
A simple Short setup can be:
- Wait for a Short signal.
- Check whether the market is showing bearish momentum.
- Look for price to reject a higher/red zone or move below the middle line.
- Enter a sell trade after confirmation.
- Put your Stop Loss above a recent swing high.
- Target a nearby support area or use your predetermined risk/reward ratio.
In the image, the Short signal appears after price has moved higher and then starts turning downward. This is the type of price movement a scalper can watch for.
4. What Are EQH and EQL?
You can also see labels such as EQH and EQL.
EQH (Equal Highs) means price has formed highs around a similar level. This area can act as an important resistance or liquidity area.
EQL (Equal Lows) means price has formed lows around a similar level. This can become an important support or liquidity area.
These levels can help you decide where to place targets or where price might react.
5. What Does MSS+ Mean?
MSS generally refers to Market Structure Shift. It indicates that the recent market structure may be changing.
For example, if the market has been making lower highs and lower lows but then breaks an important previous high, the market may be shifting toward bullish conditions.
MSS can therefore be used as an additional confirmation rather than treating the Long or Short signal alone as an entry.
6. Main Benefits of This Indicator
The major benefits are:
- Easy visual signals: Long and Short labels make possible setups easier to spot.
- Useful for scalping: It is particularly designed around short-term market movements.
- Trend awareness: Colored zones help you see bullish and bearish areas.
- Market structure: MSS information can help identify potential trend changes.
- Support and resistance: EQH and EQL can highlight important price areas.
- Less chart clutter: Several pieces of information are displayed directly on the chart.
7. Best Way to Use It
For better results, do not trade every Long or Short signal. First check the overall direction, market structure, candle confirmation, and important support/resistance levels.
A simple strategy is:
Long: Long signal + bullish structure + price confirmation → Buy → Stop Loss below support → Target resistance.
Short: Short signal + bearish structure + price confirmation → Sell → Stop Loss above resistance → Target support.
Finally, always use proper risk management. On a 1-minute chart, price can move very quickly and false signals are common. Risking only a small portion of your trading account on each trade and testing the indicator on a demo account before using real money can help you understand how it behaves.
In simple words: this indicator helps you answer three important questions—Where is the market moving? Where might price react? And where could a possible buy or sell opportunity appear?
TradingView Indicator Installation Method :-
Step 1 – Copy/Paste Custom Code
Step 2 – Open TradingView and open any chart.
Step 3 – At the bottom of the chart, click Pine Editor.
Step 4 – Click Open → New blank indicator (or New indicator).
Step 5 – Delete the existing code.
Step 6 – Paste your custom Pine Script code.
Step 7 – Click Save and give the indicator a name.
Step 8 – Click Add to chart.
All Done – Your custom indicator will now appear on the chart
Our Payment Options:👇
1) Bitcoin Wallet:
14vtHib35eUirhcXiKRUqUs7Ejcy51gFNu
2) USDT(Tether) Wallet: (ERC20)
0x254b7bdbea655bfaf428ffd8010945b04a369114
3) TRX(Tron) Wallet: (TRC20)
TJPTi6GtfAs2P2mJaAYsR4LhdKpvsa5KE3
4) XRP(Ripple): Tag(370508805)
rNxp4h8apvRis6mJf9Sh8C6iRxfrDWN7AV
And another crypto wallet: on request
5) Visa/Master Card Via Payment Link: On Request
6) Western Union: On Request
7) This Website(www.ForexProStore.com). You can purchase directly from website by Your Credit/Debit Cards and All crypto currencies and Instant Download Indicator Files.
Send payment screenshot to: 👇🏿
Payment After we will provide product within 30 minutes.
If you want any proofs of Indicator or have any questions then feel free to message
WhatsApp: Click Here
Telegram: Click Here
Mail Us: Click Here
Thank You ❤️
Related products
MT4 Indicators
TradingView Indicators

MT4 Indicators
TradingView Indicators
TradingView Indicators
TradingView Indicators

MT4 Indicators
TradingView Indicators