
Fast Entry Binary Indicator
Original price was: $1,200.00.$245.00Current price is: $245.00.
⭐ Binary Options Indicator Features
✅ Original & Reliable Binary Indicator
🎯 CALL & PUT Entry Signals
⚡ Fast & Clear Arrow Signals
⏱️ Multiple Timeframes Supported
📈 Suitable for Short-Term Trading
💻 Works on Mobile, Tablet & PC
🌍 Works with Forex, Crypto & Stock Assets
🔄 Easy-to-Use Trading Signals
📊 Expiry-Based Binary Options Strategy
🛠️ Customer Support & Free Updates
💎 One-Time Payment • Lifetime Use
How to Use the Binary Option & Forex Trend Arrow Indicator
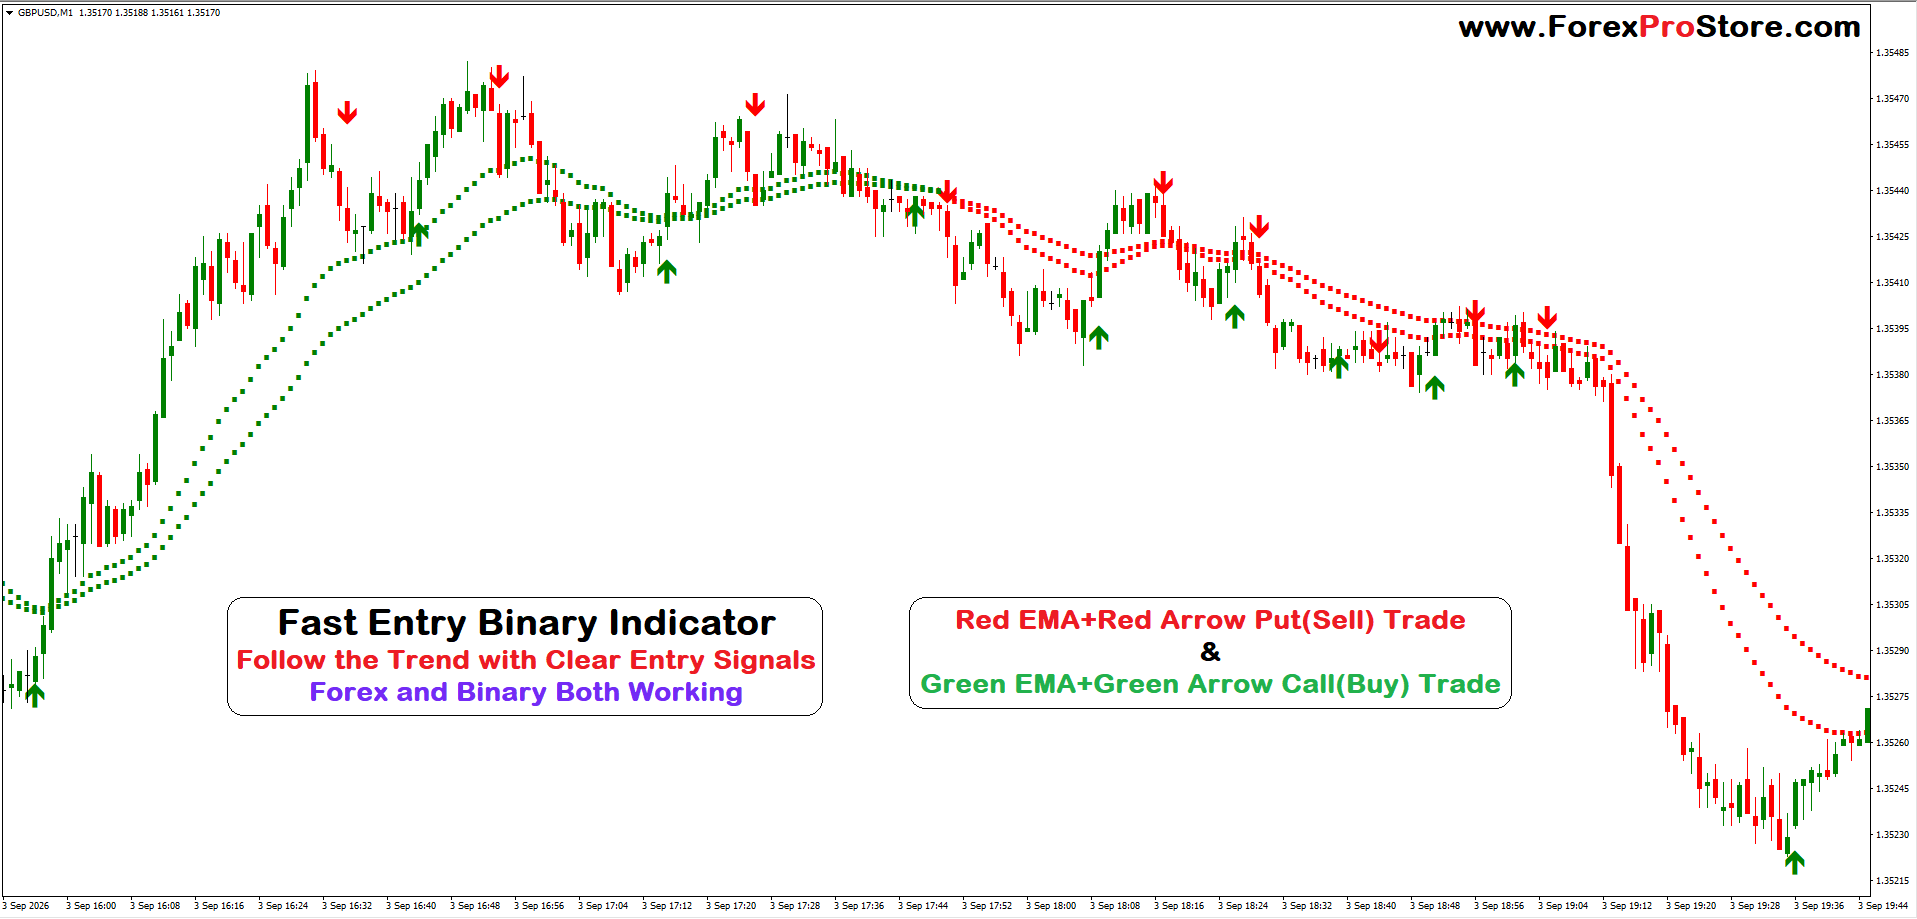
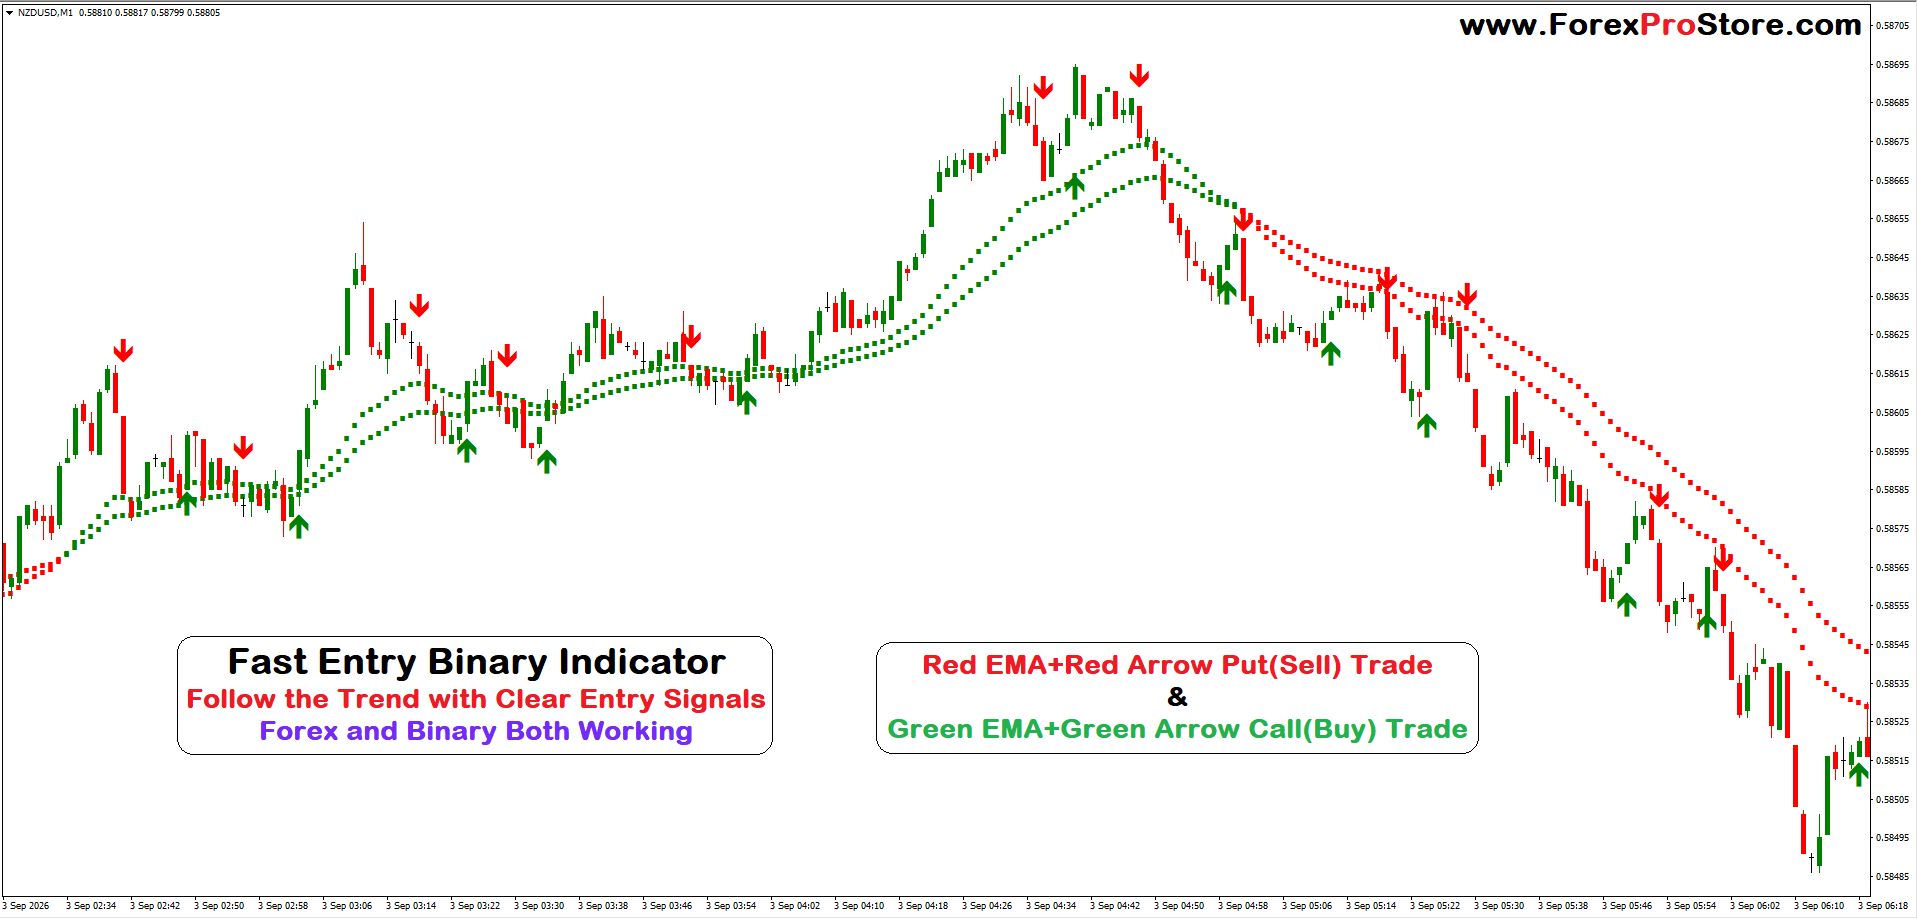
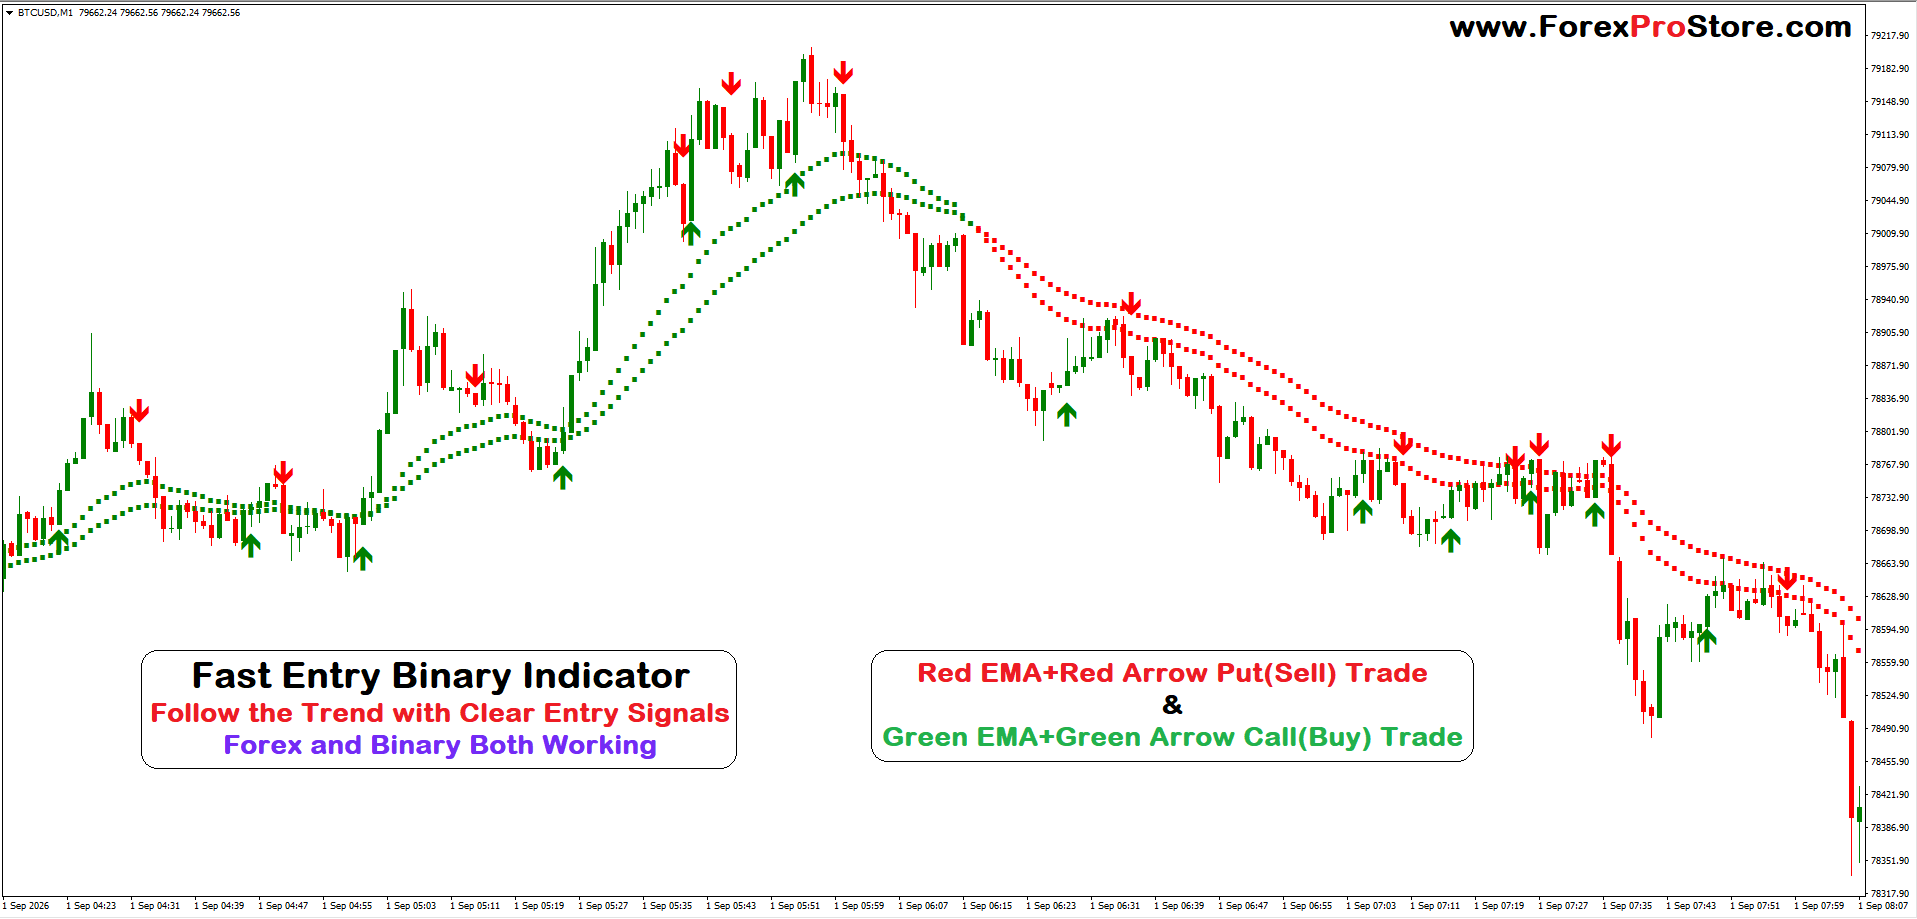
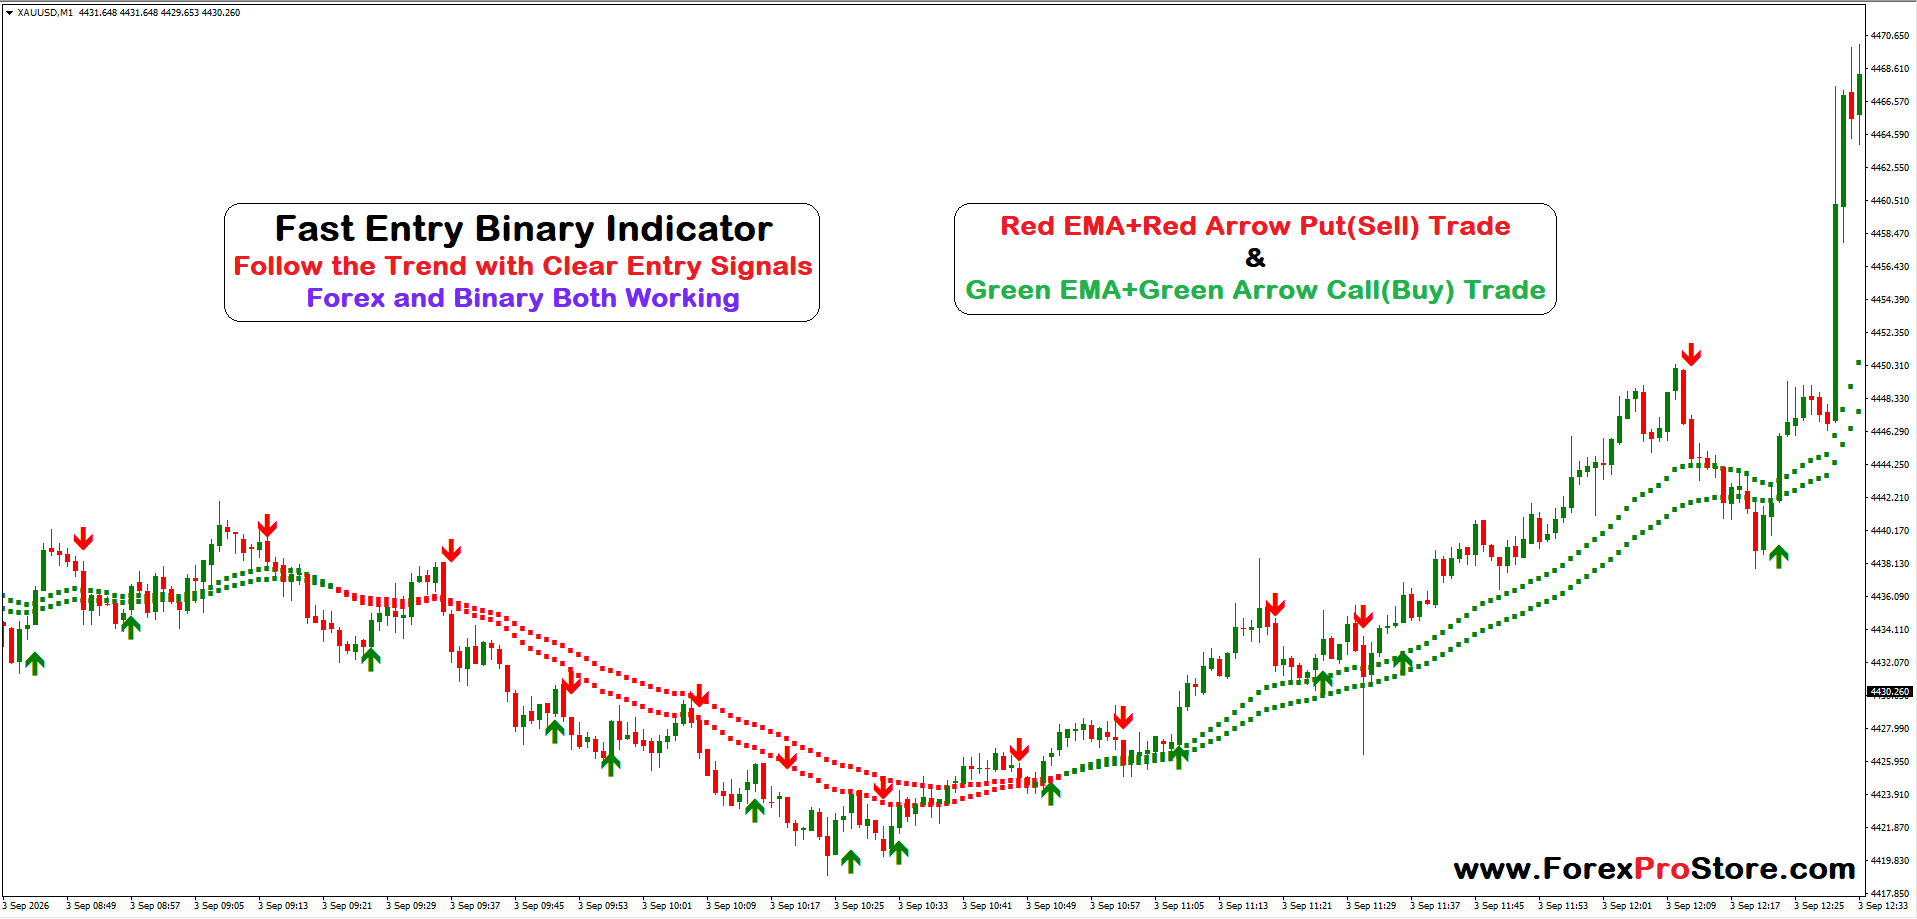
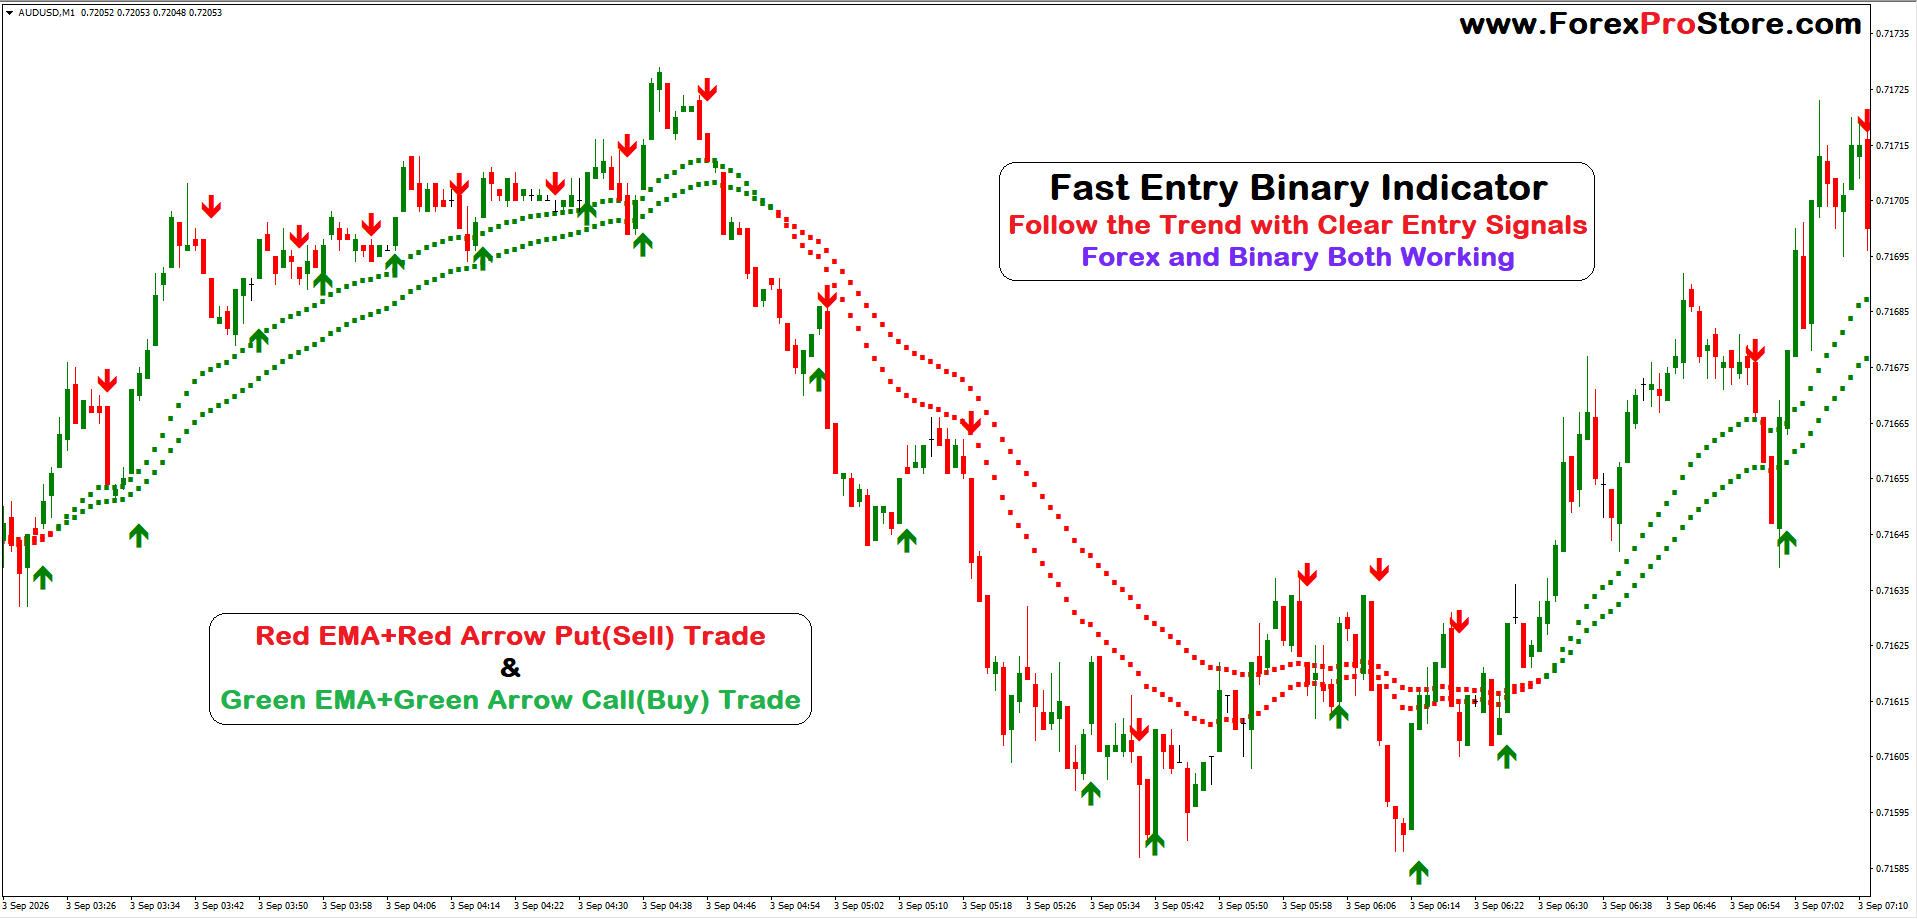
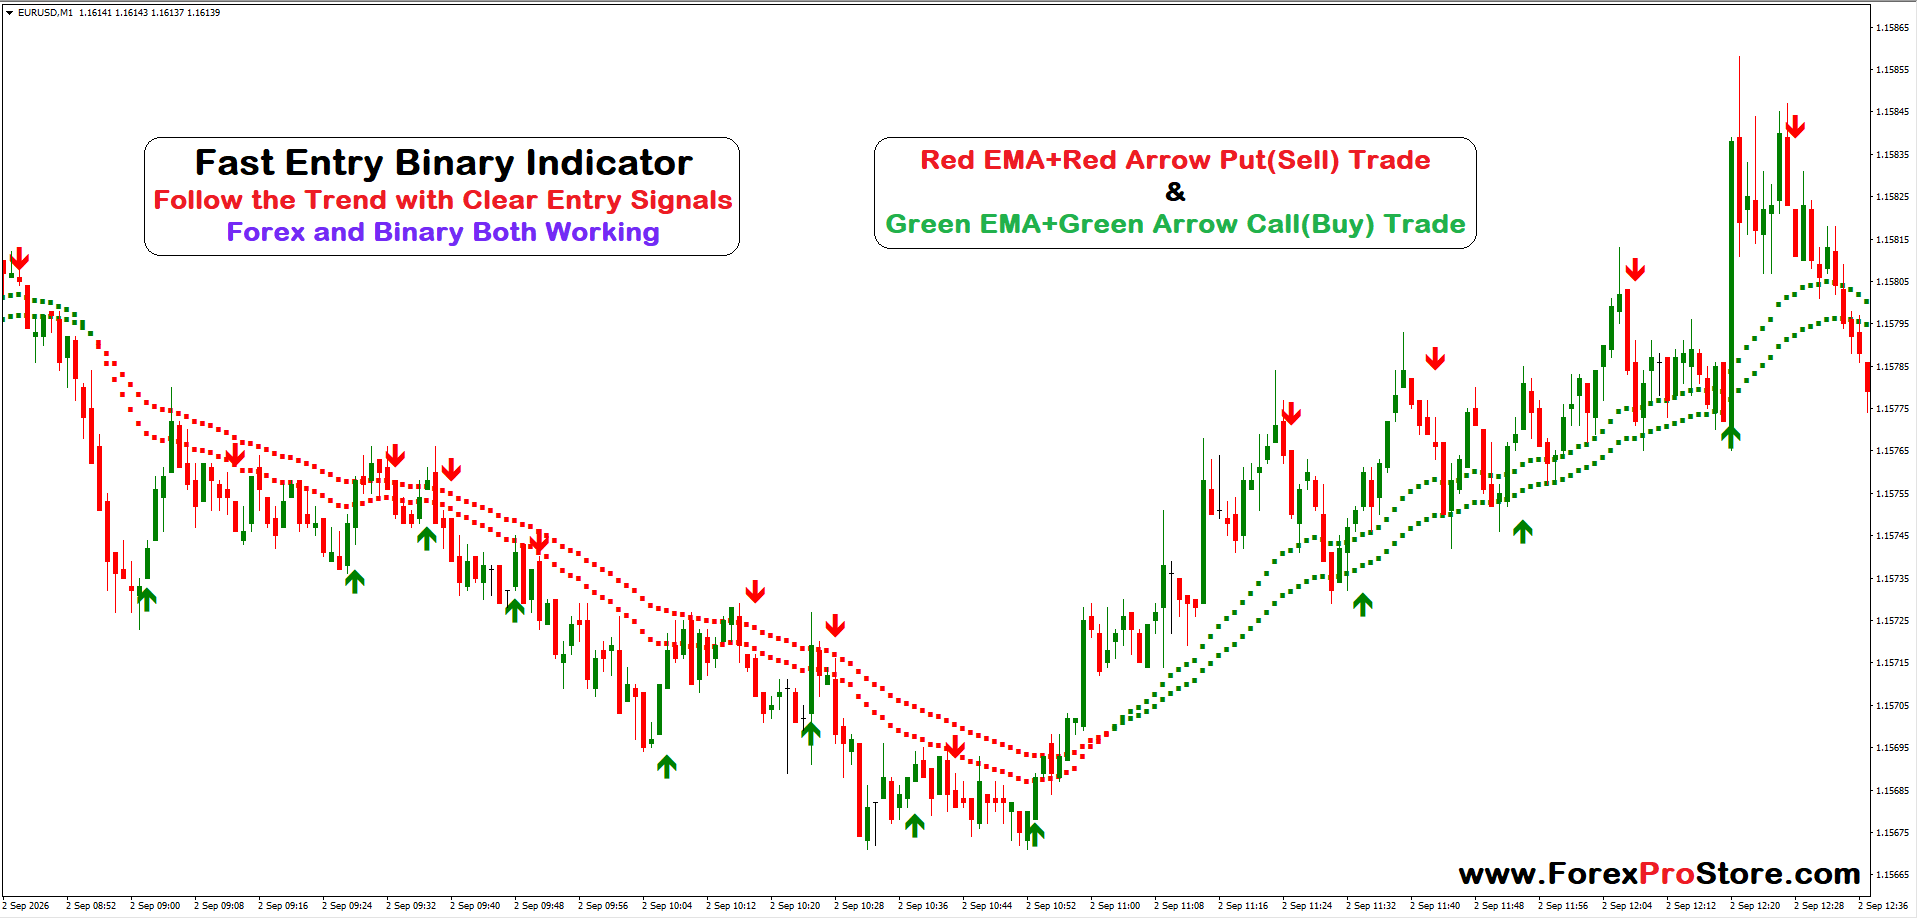
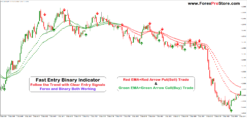
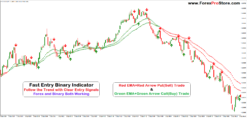
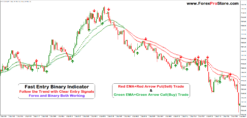
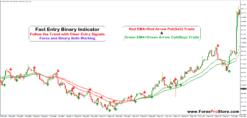
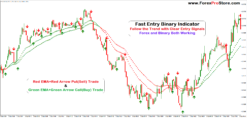
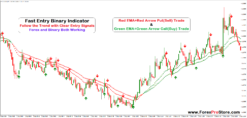
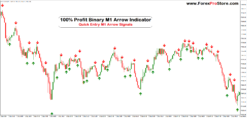
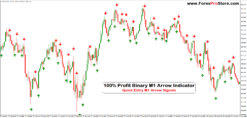
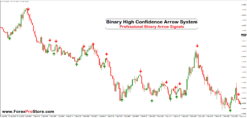
The indicator shown in your chart is designed to make trend direction and possible entry points easier to see. It uses green/red dotted EMA-style trend lines together with green and red arrows. The chart example is on the M1 (1-minute) timeframe, so it is mainly useful for short-term trading and scalping.
1. Understand the Signals
The indicator has two main components:
🟢 Green Arrow — CALL / BUY
A green upward arrow generally indicates a possible bullish or upward move.
For example, in the image, green arrows appear below candles during periods where price is moving upward.
For a Forex trade, this can be treated as a potential BUY setup.
For a binary option, it can be used as a possible CALL/Up setup, particularly when the surrounding trend is also bullish.
🔴 Red Arrow — PUT / SELL
A red downward arrow generally indicates a possible bearish or downward move.
When a red arrow appears above the candles, it suggests that sellers may be gaining control.
For Forex, this can be considered a potential SELL setup.
For binary options, it can be considered a possible PUT/Down setup.
2. Follow the EMA/Trend Direction
Don’t rely only on the arrow. First look at the dotted trend lines.
Green trend lines
When the dotted lines are green and moving upward, the market is showing bullish conditions.
In this situation, give greater attention to green BUY/CALL arrows.
A simple approach is:
Green trend → Wait for green arrow → Check candle → Consider CALL/BUY
Red trend lines
When the dotted lines become red and slope downward, the market is showing bearish conditions.
In this situation, give greater attention to red SELL/PUT arrows.
A simple approach is:
Red trend → Wait for red arrow → Check candle → Consider PUT/SELL
This helps prevent taking every arrow that appears during sideways or choppy market conditions.
3. How to Use It for Binary Options
Suppose you are trading on the M1 timeframe.
A basic method could be:
Step 1: Open your preferred currency pair.
Step 2: Select the M1 timeframe if your strategy is designed for 1-minute entries.
Step 3: Check the dotted trend lines.
Step 4: Identify whether the overall direction is green/up or red/down.
Step 5: Wait for an arrow that agrees with the trend.
Step 6: Look at the candle associated with the signal. Avoid entering blindly in the middle of a very large candle.
Step 7: For a CALL, look for bullish confirmation. For a PUT, look for bearish confirmation.
Step 8: Use an expiry appropriate to your tested strategy rather than assuming every M1 signal should have exactly a 1-minute expiry.
For example, if the market is trending downward and a red arrow appears above price, you would look for a possible PUT setup rather than taking a CALL against the trend.
4. How to Use It for Forex
The same indicator can also be used for Forex trading.
For a BUY, look for:
- Green trend lines
- Upward market structure
- Green arrow
- Bullish candle confirmation
- Reasonable entry location
For a SELL, look for:
- Red trend lines
- Downward market structure
- Red arrow
- Bearish candle confirmation
- Reasonable entry location
Unlike binary options, Forex trades should normally have a clearly defined stop-loss and take-profit or another risk-management exit.
5. Don’t Trade Every Arrow
This is one of the most important points.
The chart contains many arrows, but that does not mean every arrow is a high-probability trade.
During a strong trend, signals that agree with the trend can be more useful than signals that attempt to predict a reversal.
For example:
Strong downtrend + red arrow = stronger setup to investigate
while:
Strong downtrend + green arrow = potentially risky counter-trend setup
The same principle applies in an uptrend.
You can also avoid trading when the dotted lines repeatedly change between green and red. This often indicates a sideways/choppy market, where short-term signals can become less reliable.
6. Main Benefits of the Indicator
✅ Easy-to-understand signals
The colored arrows make possible entry areas visually simple to identify.
✅ Trend identification
The colored dotted lines help you quickly recognize whether the market is generally moving upward or downward.
✅ Useful for short-term trading
The M1 presentation makes it suitable for traders interested in fast setups and scalping, provided the strategy has been properly tested.
✅ Works for different trading styles
The basic signals can be adapted for Forex BUY/SELL trading and for studying potential binary CALL/PUT opportunities.
✅ Reduces chart clutter
Instead of manually watching several indicators, you can use the visual trend and arrow signals as a starting point for analysis.
✅ Helps with trade discipline
Having predefined signal conditions can help traders avoid entering simply because a candle looks attractive.
7. Best Way to Improve the Signals
For better decision-making, combine the indicator with basic market analysis.
Check:
Trend + Arrow + Candle Confirmation + Support/Resistance + Risk Management
For example, a green arrow near a strong support area during an established uptrend may deserve more attention than a green arrow appearing randomly in the middle of a sideways market.
You can also test additional confirmation tools such as RSI, MACD, moving averages, or support/resistance. However, adding too many indicators can make the chart confusing.
Final Summary
The Binary Option & Forex Trend Arrow Indicator is primarily a visual tool for identifying potential BUY/CALL and SELL/PUT opportunities. Green arrows generally represent bullish opportunities, while red arrows generally represent bearish opportunities. The dotted green/red trend lines provide additional direction.
The simplest approach is:
Follow the trend → Wait for matching arrow → Confirm the candle/market structure → Enter only when your tested rules are satisfied → Manage risk.
Related products
Binary Indicators
Binary Indicators
Binary Indicators
Binary Indicators
Binary Indicators
Binary Indicators
Binary Indicators
Binary Indicators