
Binary No-Risk Signal Indicator
Original price was: $1,000.00.$220.00Current price is: $220.00.
⭐ Binary Options Indicator Features
✅ Original & Reliable Binary Indicator
🎯 CALL & PUT Entry Signals
⚡ Fast & Clear Arrow Signals
⏱️ Multiple Timeframes Supported
📈 Suitable for Short-Term Trading
💻 Works on Mobile, Tablet & PC
🌍 Works with Forex, Crypto & Stock Assets
🔄 Easy-to-Use Trading Signals
📊 Expiry-Based Binary Options Strategy
🛠️ Customer Support & Free Updates
💎 One-Time Payment • Lifetime Use
The Binary Martingale Strategy (100% Winning Rules)
The 1, 3, 9, 18, 27, 40 rule is a money-management sequence used with binary indicator signals. Start with 1 unit on the first signal. If the trade loses, increase the next stake to 3 units. After another loss, use 9 units, followed by 18, 27, and then 40 units. When a trade wins, return to the starting 1-unit amount and repeat the sequence. The idea is to recover previous losses and potentially finish the cycle with a profit.
How to Use This Binary Option Indicator
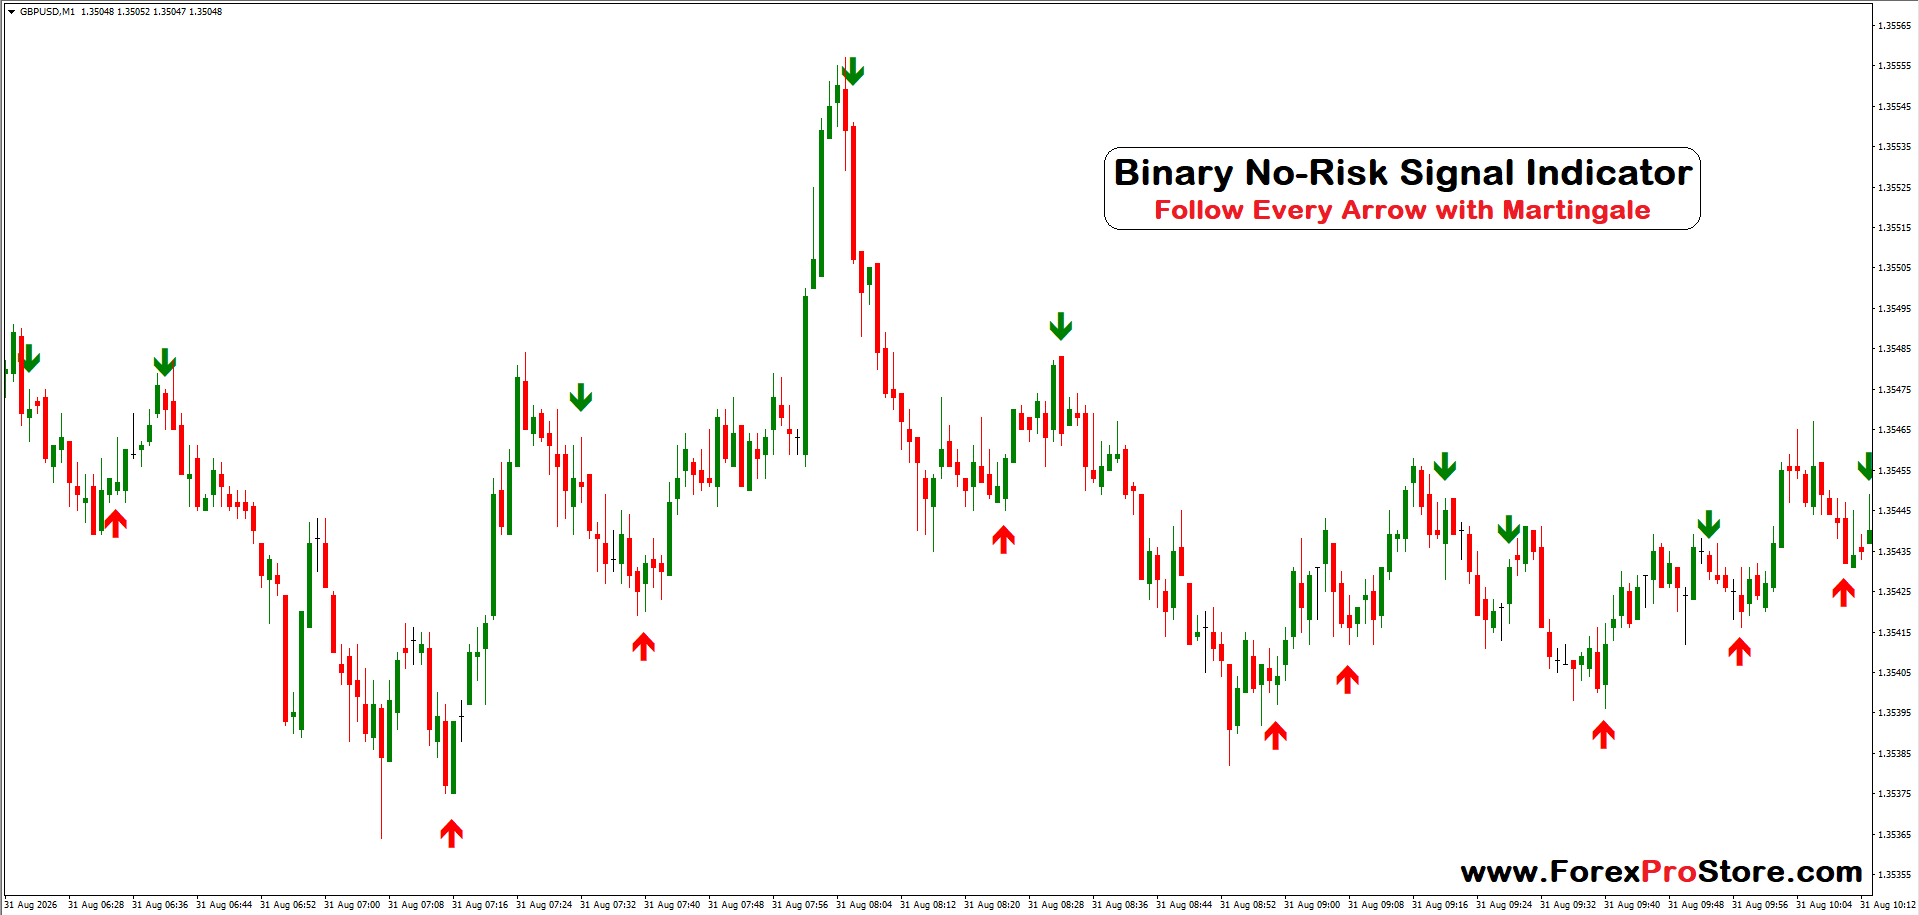
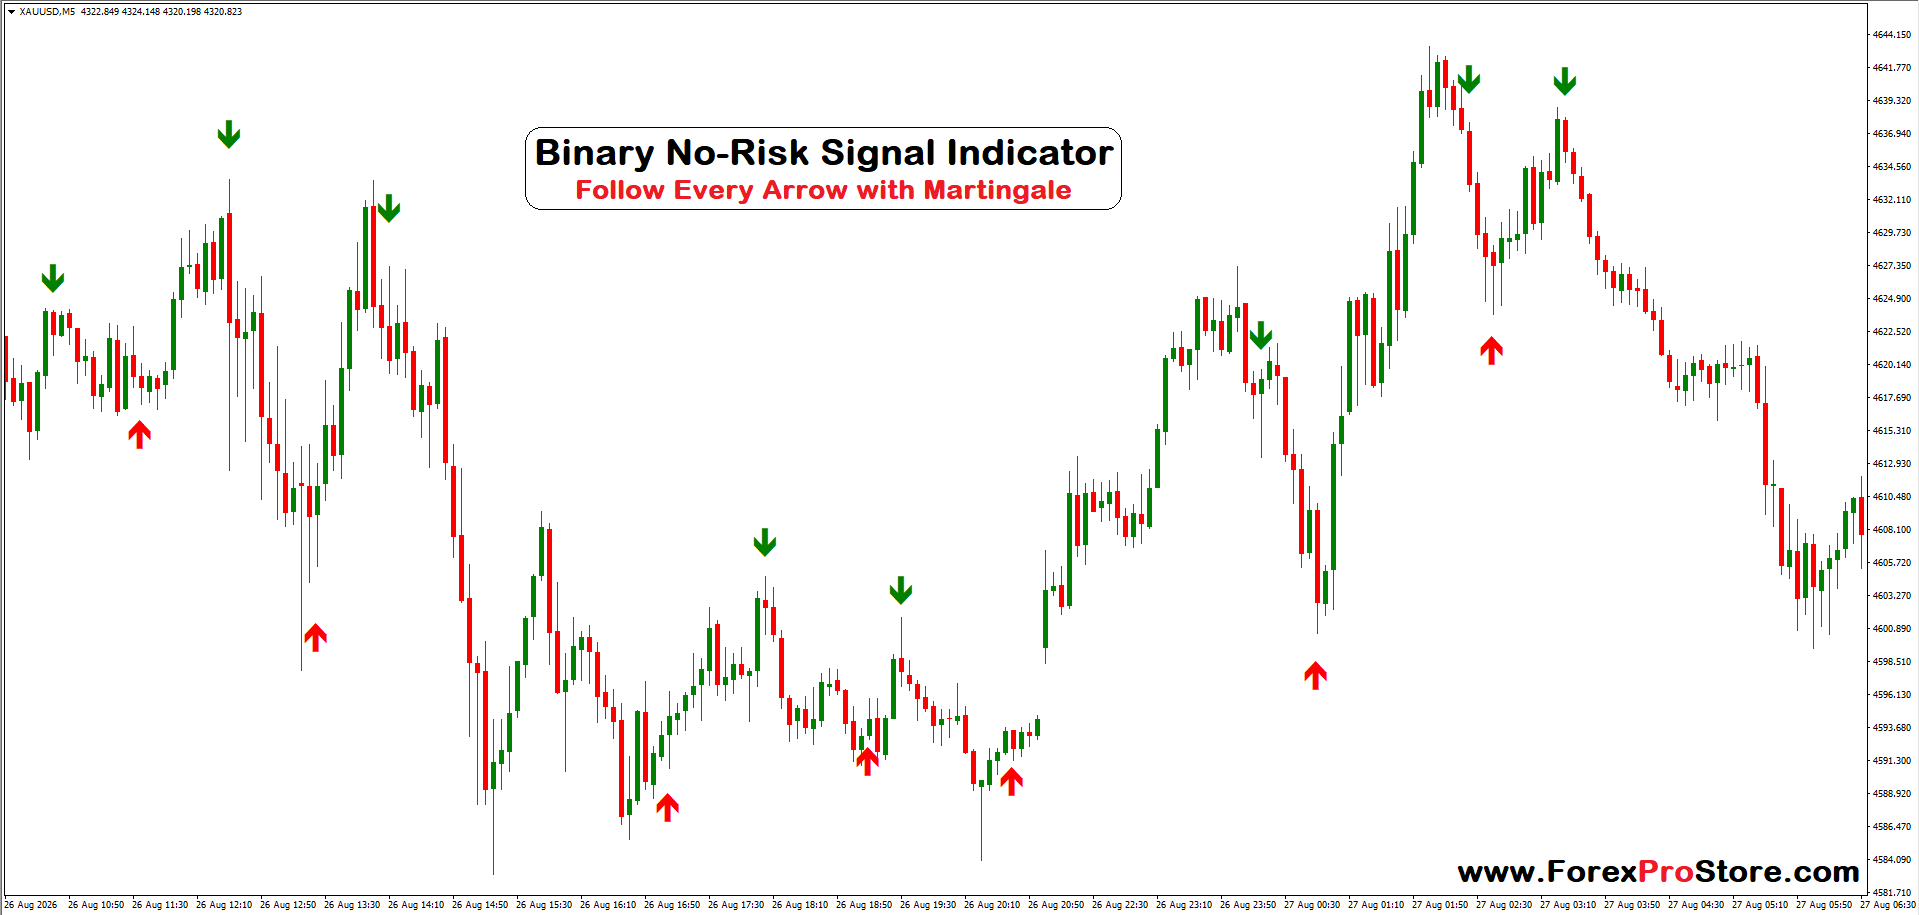
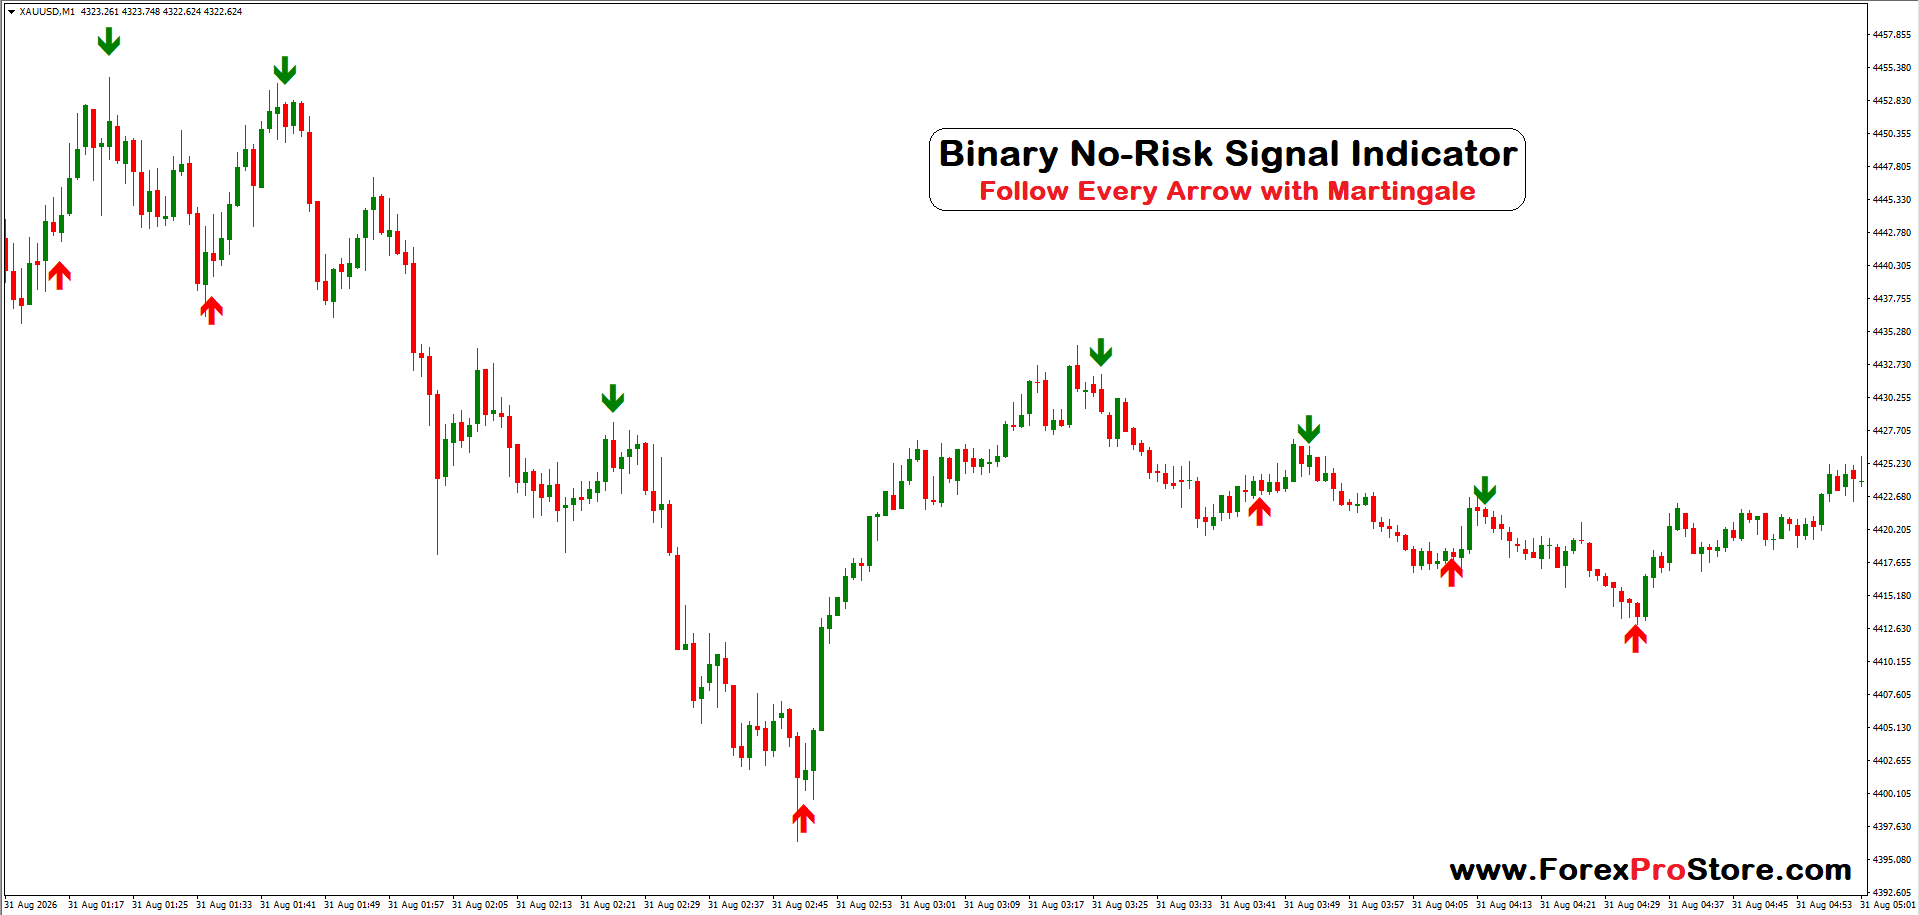
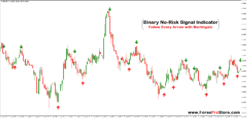
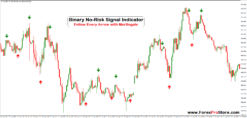
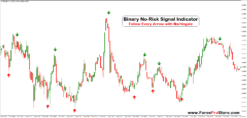
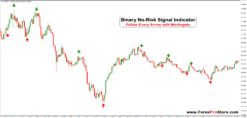
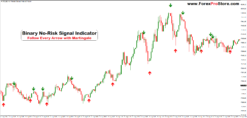
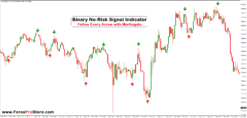
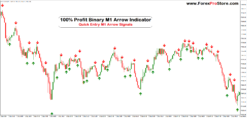
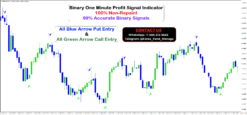
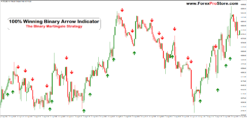
The indicator shown in your image is a Binary Arrow Signal Indicator designed to display potential UP (CALL) and DOWN (PUT) opportunities on the chart. The chart is set to XAUUSD (Gold) on the 1-minute (M1) timeframe.
1. Understand the Arrows
The indicator uses two main arrows:
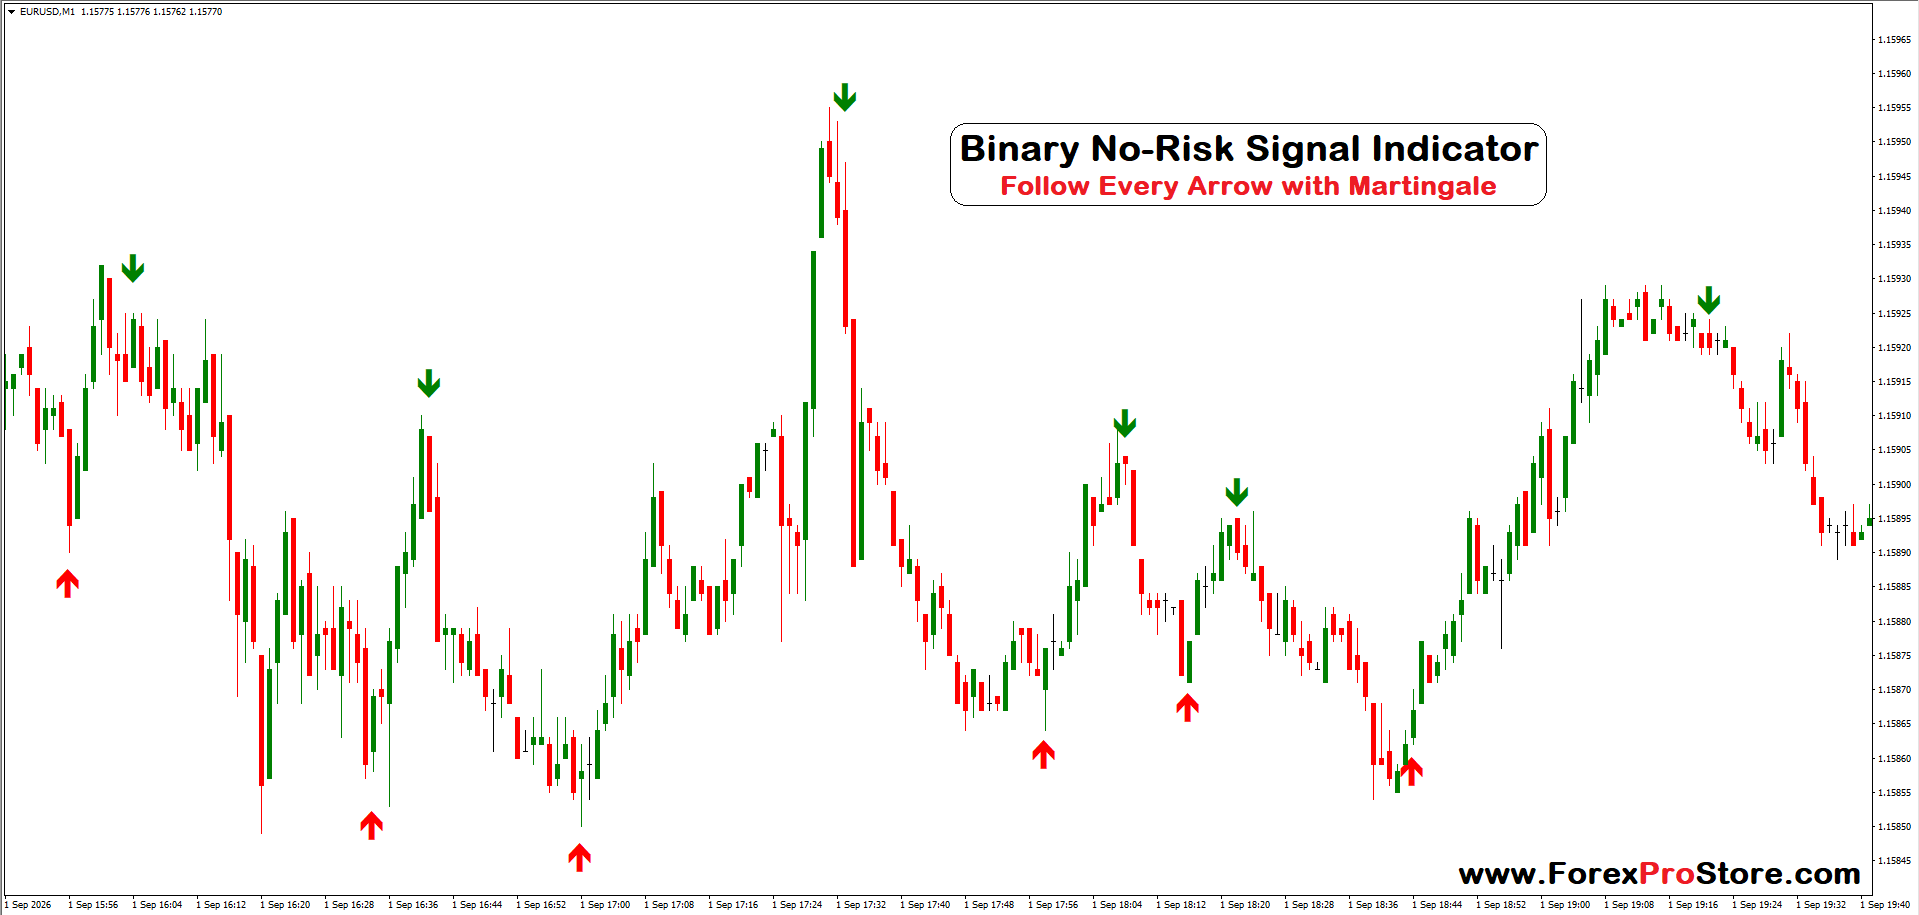
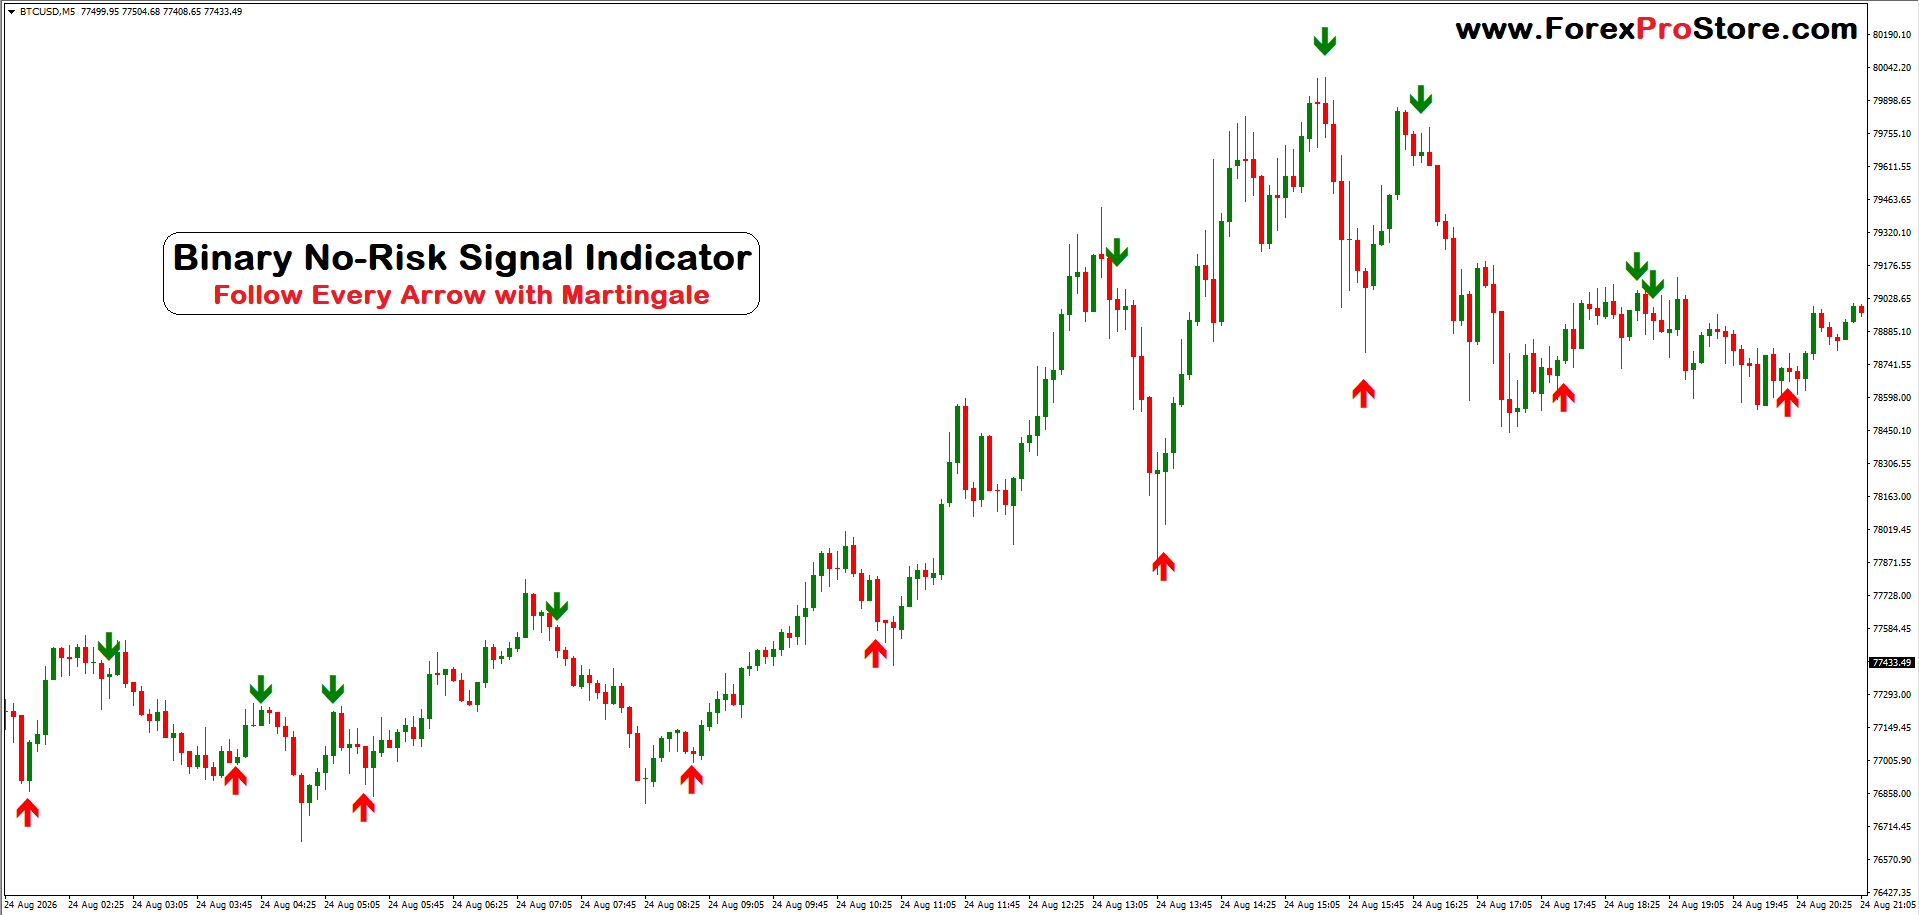
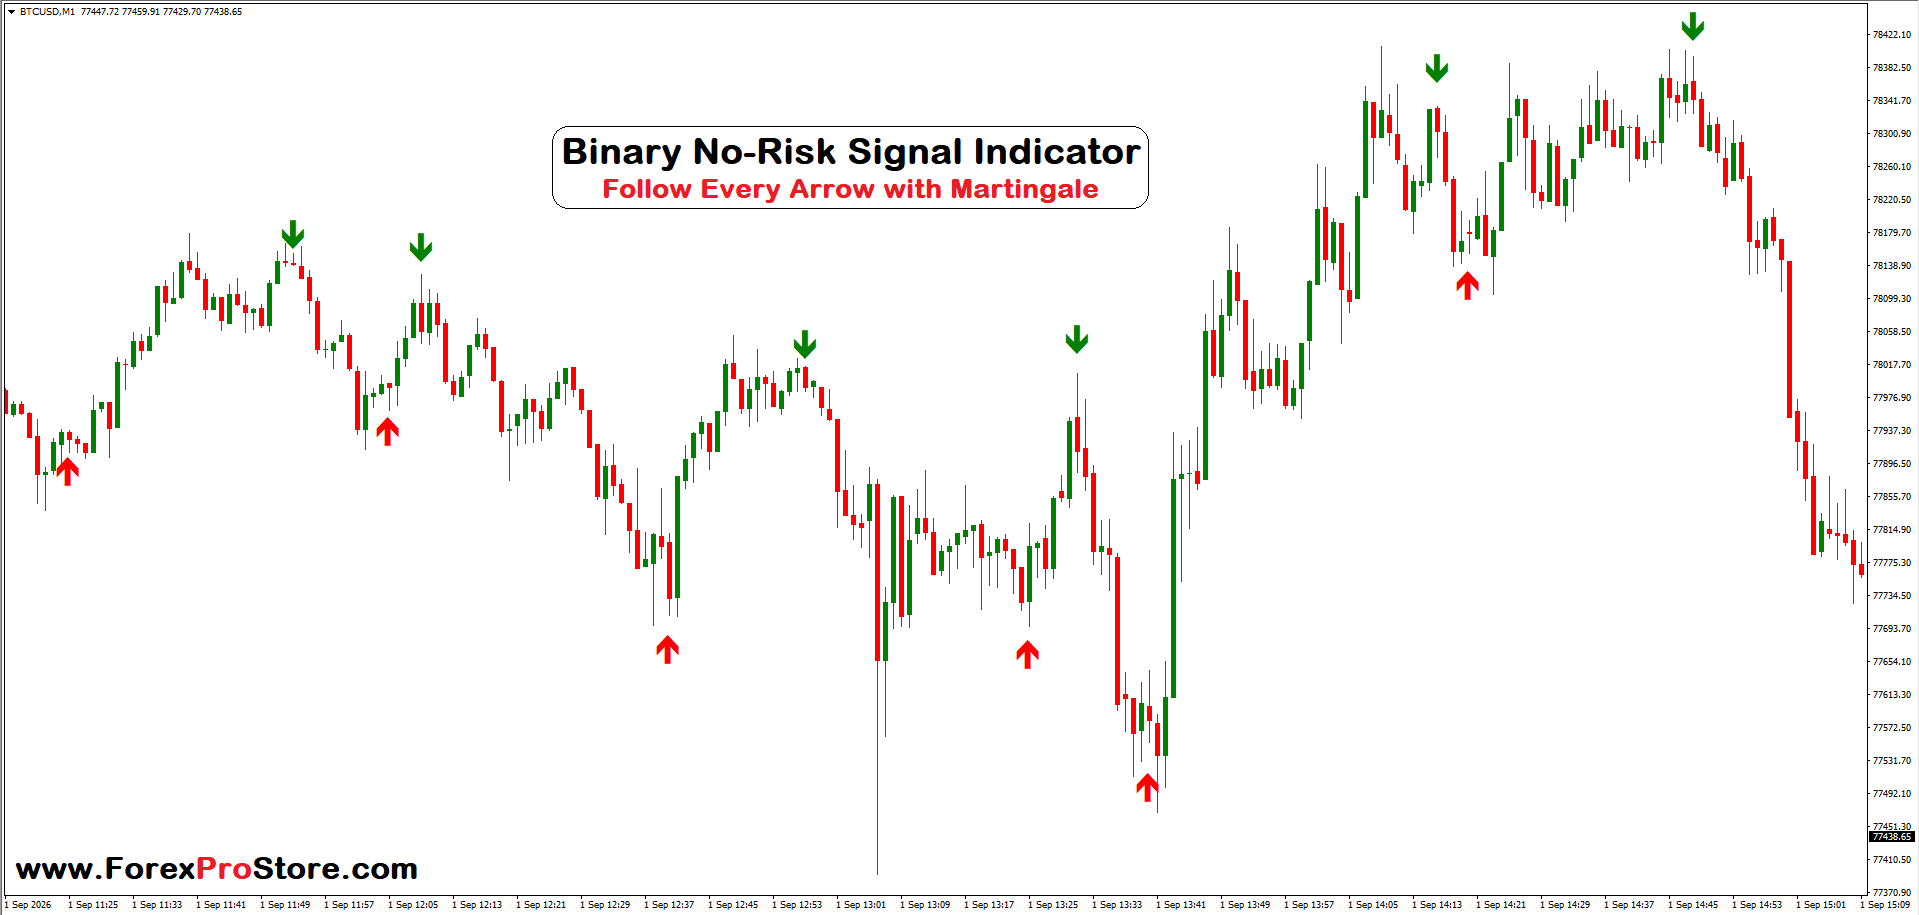
- 🔴 Red Up Arrow → Potential CALL / UP signal. It suggests that price may move upward.
- 🟢 Green Down Arrow → Potential PUT / DOWN signal. It suggests that price may move downward.
For example, when a red arrow appears near a potential support/reversal area, a trader may consider an UP trade. When a green arrow appears near a potential resistance/reversal area, a trader may consider a DOWN trade.
2. Wait for the Signal
Don’t enter a trade simply because an arrow appears in the middle of a candle. A better approach is to wait until the signal candle closes and then check whether the arrow remains.
This is especially important with fast M1 trading because price can change very quickly.
3. Check the Market Direction
Use the arrow together with the overall market trend.
For example:
Uptrend + Red Up Arrow = stronger confirmation
Downtrend + Green Down Arrow = stronger confirmation
Avoid taking every signal when the market is moving sideways because sideways markets can produce more false signals.
4. Use Price Action for Confirmation
Before entering, look at the candles around the arrow.
For an UP signal, you can look for:
- Bullish candle formation
- Price bouncing from support
- Increasing upward momentum
- Previous low holding
For a DOWN signal, look for:
- Bearish candle formation
- Price rejecting resistance
- Increasing downward momentum
- Previous high holding
This can help filter weaker signals.
5. Choose Expiry Carefully
Because the example is an M1 chart, traders may use short expiry periods, but the correct expiry depends on the indicator’s design, market volatility, broker conditions, and backtesting results. Don’t assume that every arrow should automatically be traded for one minute.
Test the indicator on demo/paper trading first and determine which expiry produces the best historical results.
Benefits of the Indicator
Easy to understand: The arrows make potential trade directions visually clear.
Fast signal identification: You don’t have to manually inspect numerous indicators before noticing a possible setup.
Useful for short-term analysis: The M1 chart can help traders identify quick market movements.
Can help reduce emotional decisions: Having predefined signal rules can prevent random entries.
Works as a confirmation tool: You can combine the arrows with support/resistance, trend analysis, RSI, moving averages, or price action.
Useful for backtesting: You can review historical arrows and calculate the actual win/loss percentage before risking money.
Related products
Binary Indicators
Binary Indicators
Binary Indicators
Binary Indicators
Binary Indicators
Binary Indicators
Binary Indicators
Binary Indicators