
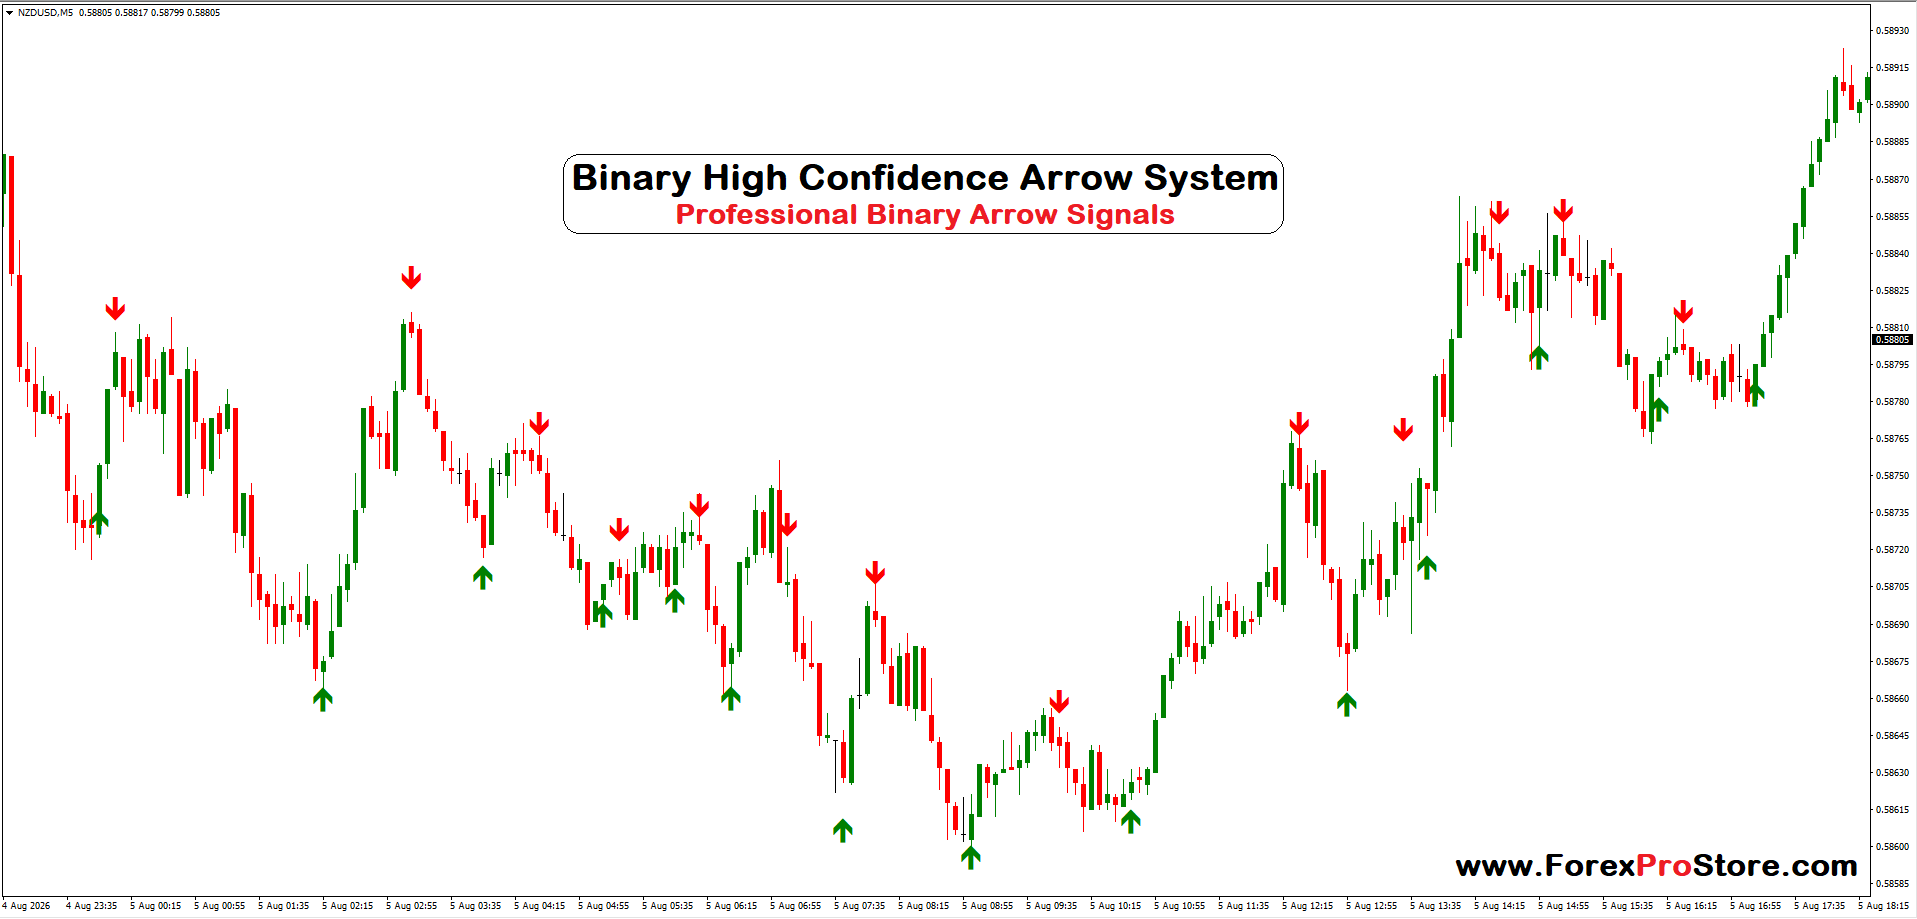
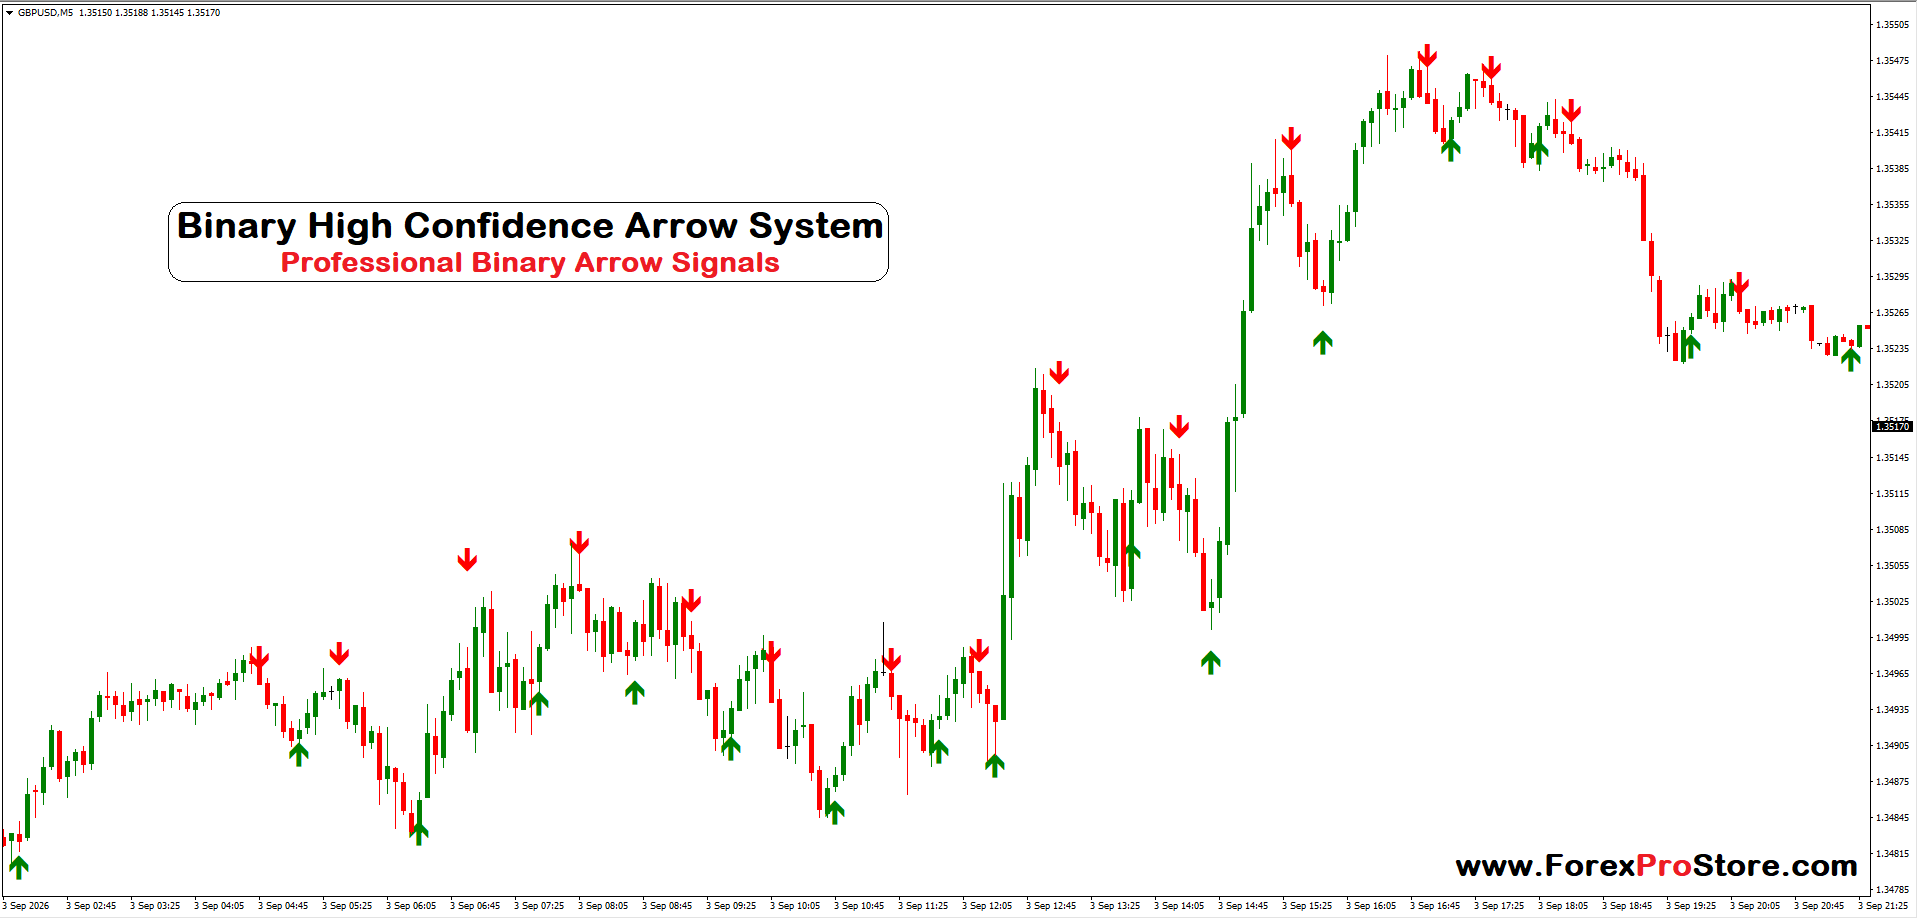
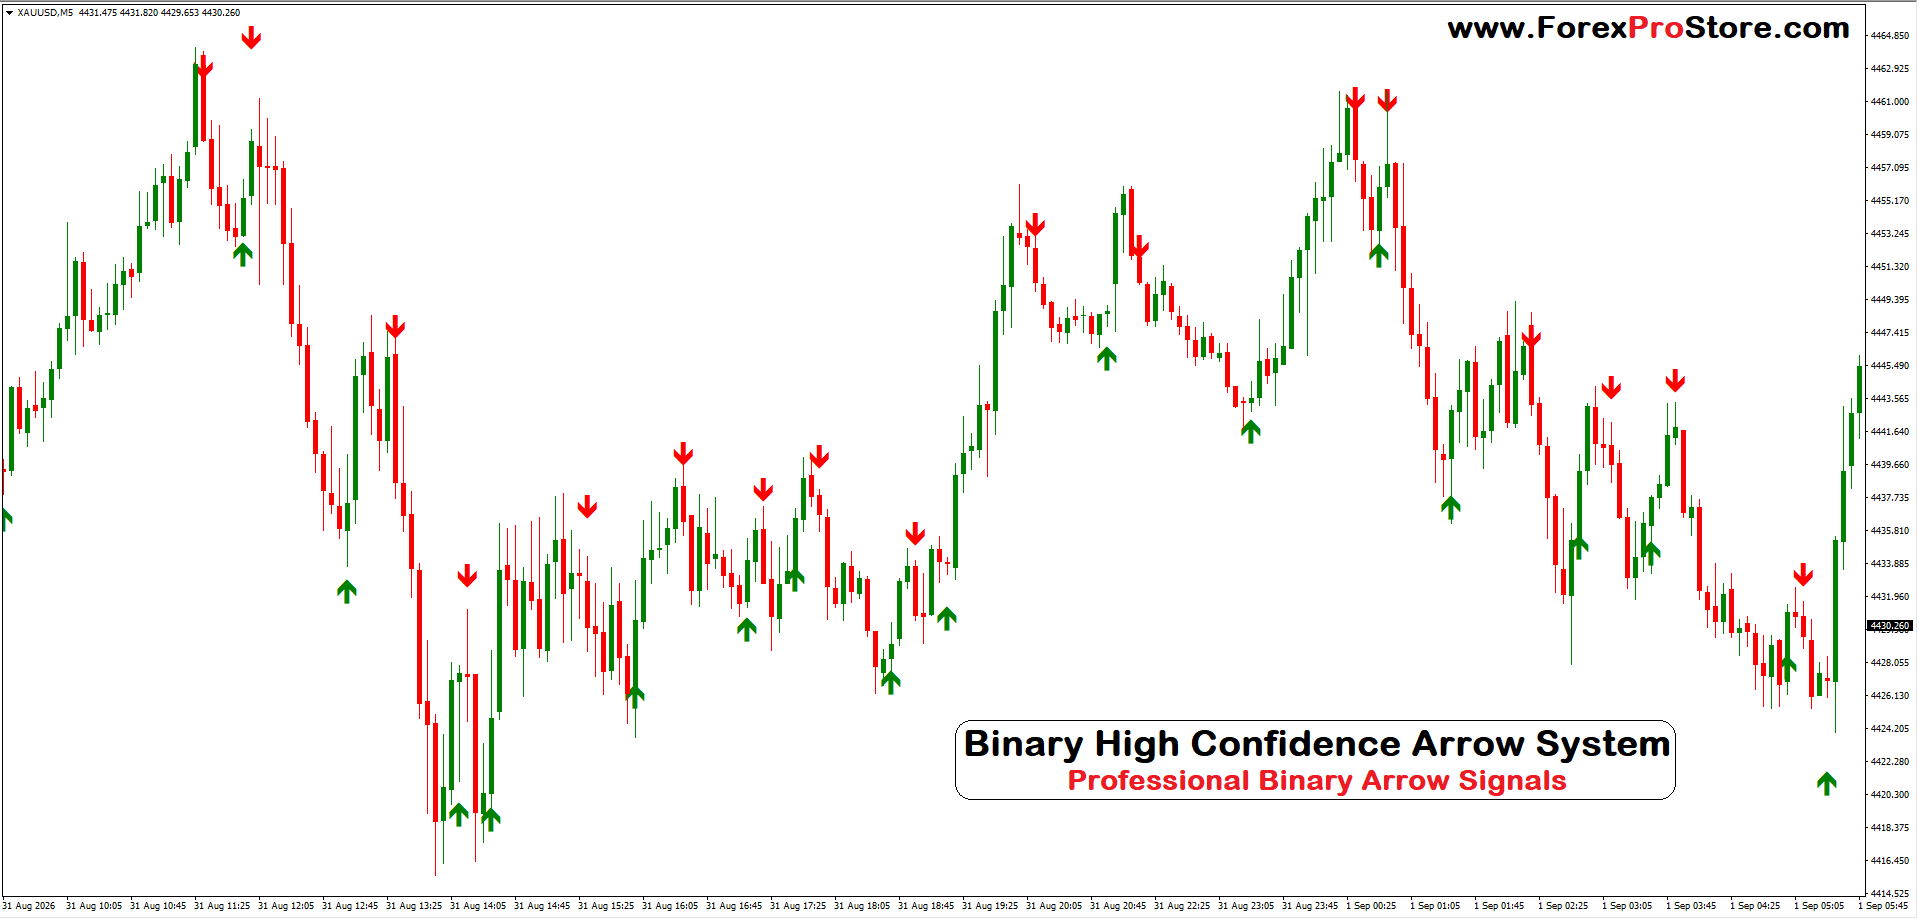
Binary High Confidence Arrow System
Original price was: $1,000.00.$350.00Current price is: $350.00.
⭐ Binary Options Indicator Features
✅ Original & Reliable Binary Indicator
🎯 CALL & PUT Entry Signals
⚡ Fast & Clear Arrow Signals
⏱️ Multiple Timeframes Supported
📈 Suitable for Short-Term Trading
💻 Works on Mobile, Tablet & PC
🌍 Works with Forex, Crypto & Stock Assets
🔄 Easy-to-Use Trading Signals
📊 Expiry-Based Binary Options Strategy
🛠️ Customer Support & Free Updates
💎 One-Time Payment • Lifetime Use
How to Use the Binary High Confidence Arrow System – Complete Guide
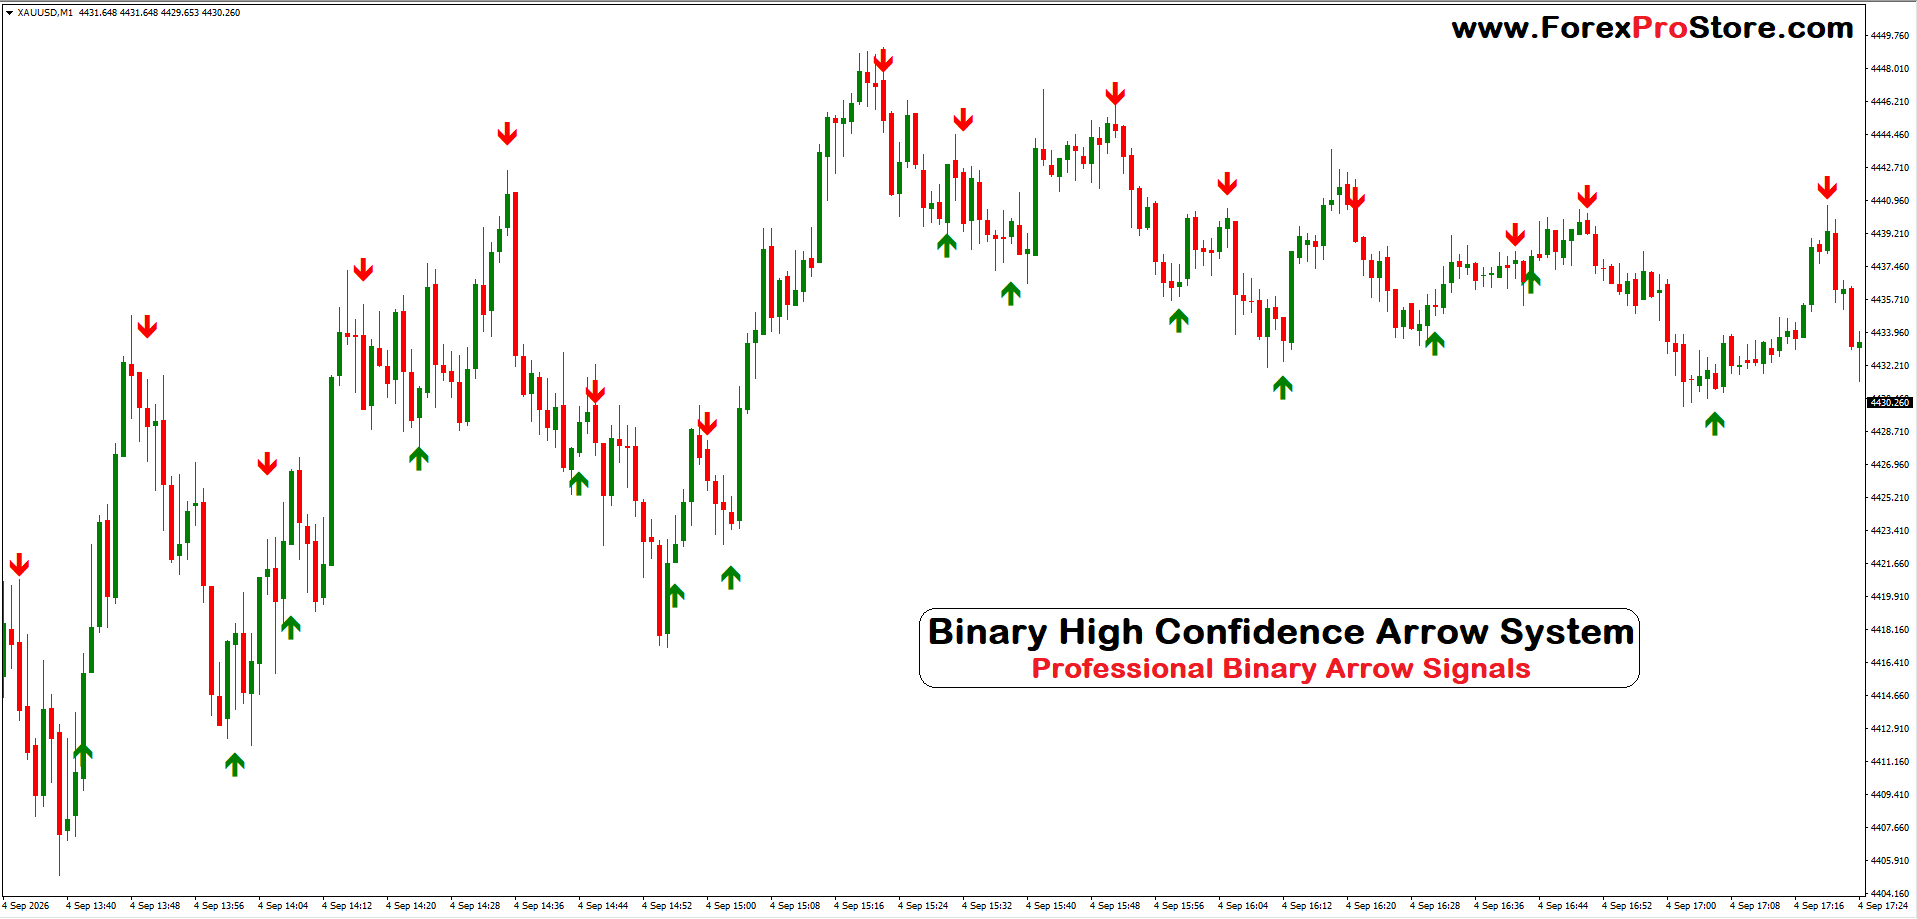
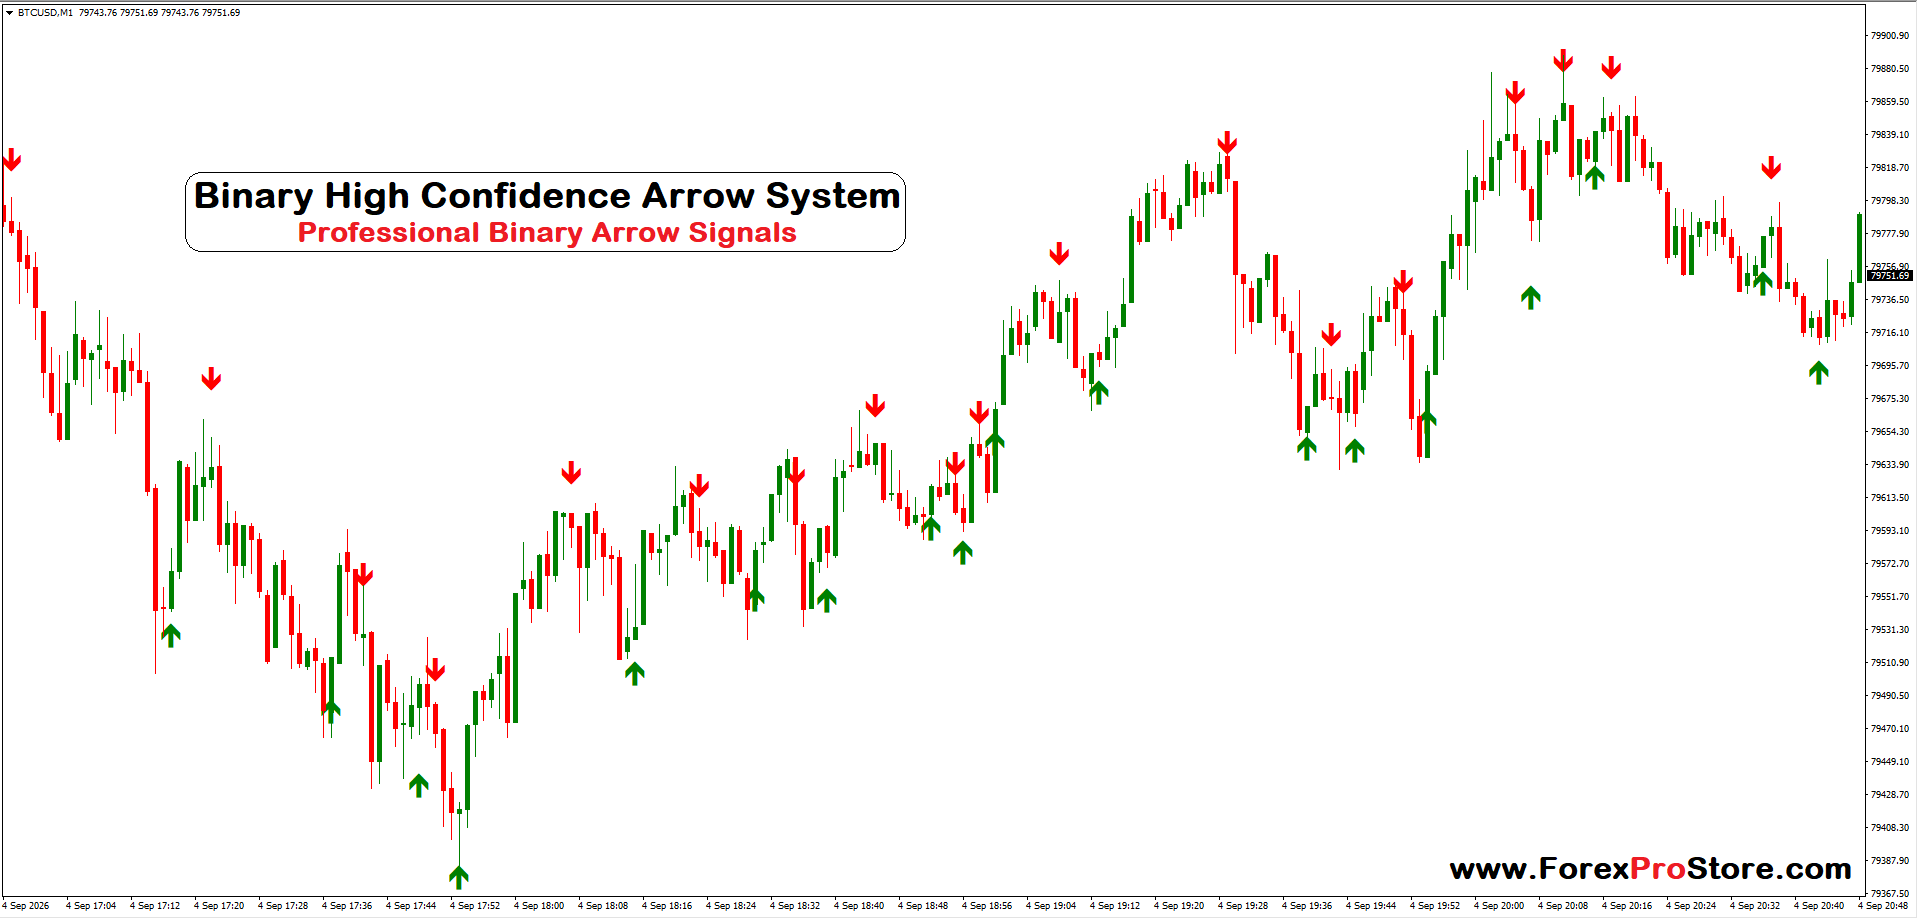
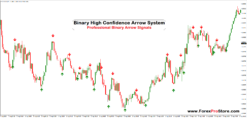
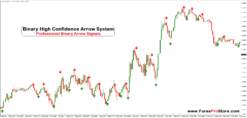
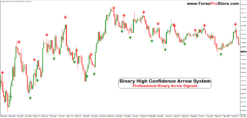
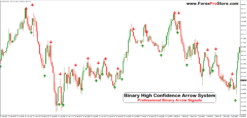
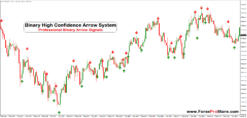
The Binary High Confidence Arrow System shown in your chart is a visual arrow-based indicator designed to help traders identify possible UP (CALL) and DOWN (PUT) opportunities. In the screenshot, the indicator is being used on XAUUSD (Gold) with the M1, or 1-minute, timeframe.
The main idea is simple: instead of trying to predict every market movement yourself, you watch for the indicator’s arrows and then confirm the market conditions before taking a trade.
1. Understanding the Arrows
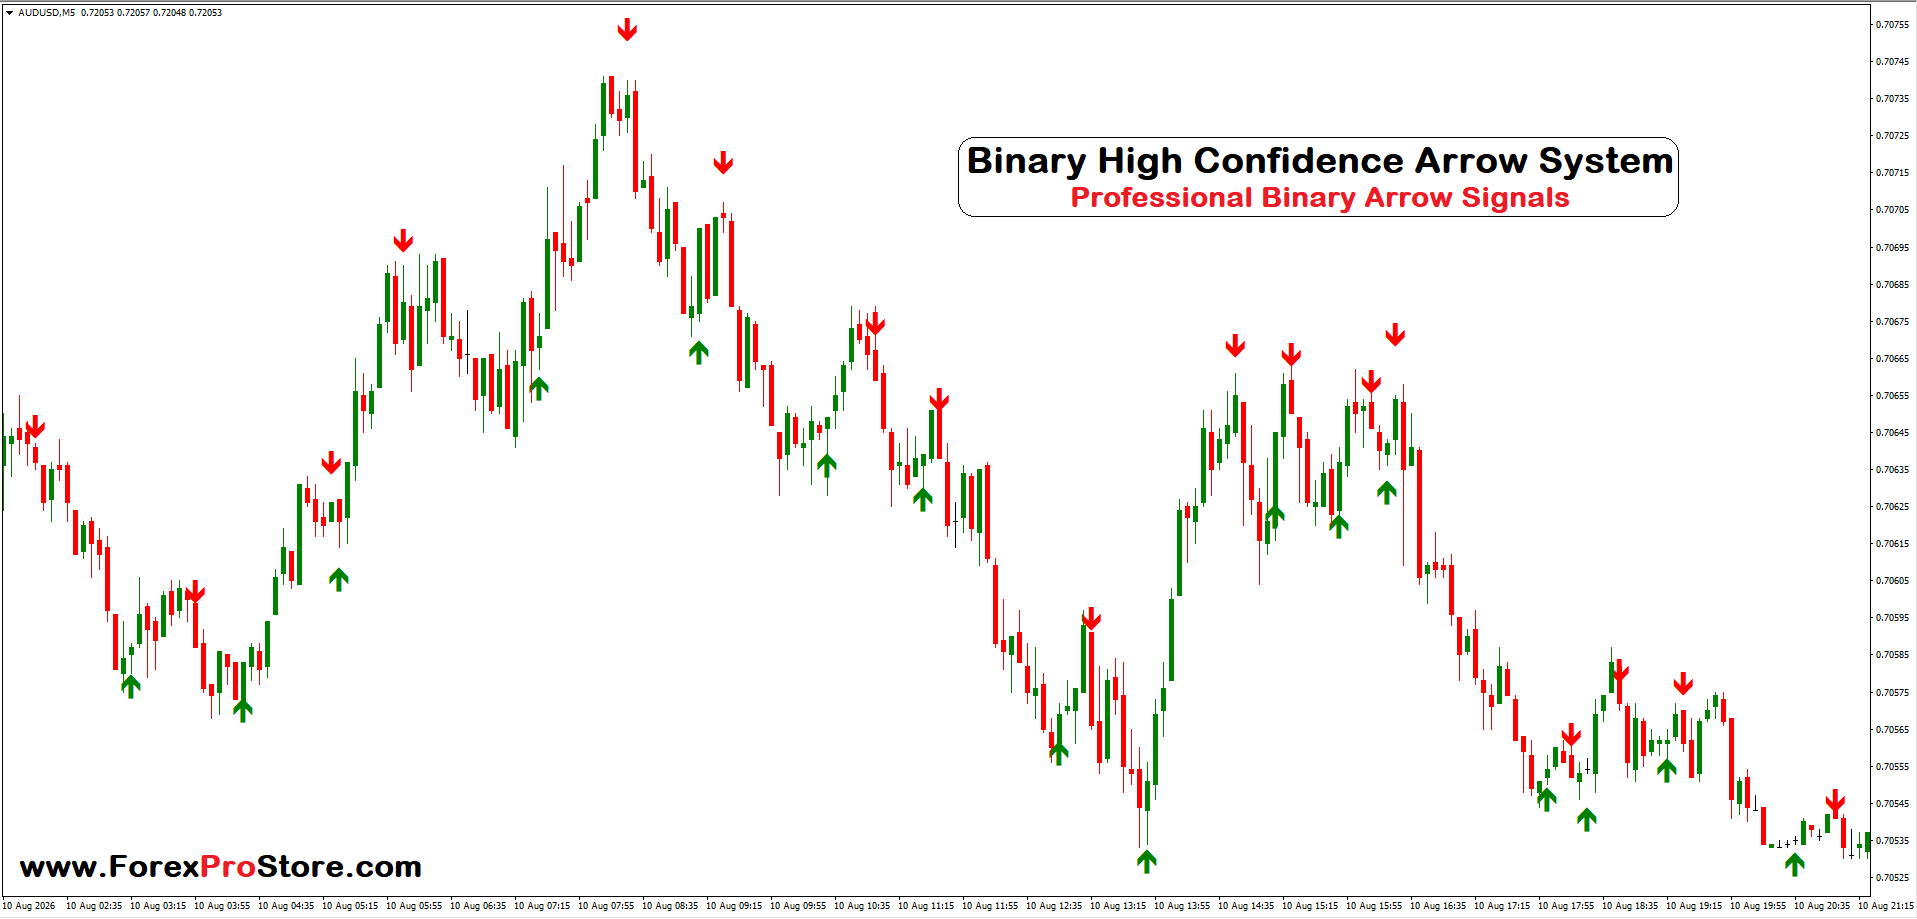
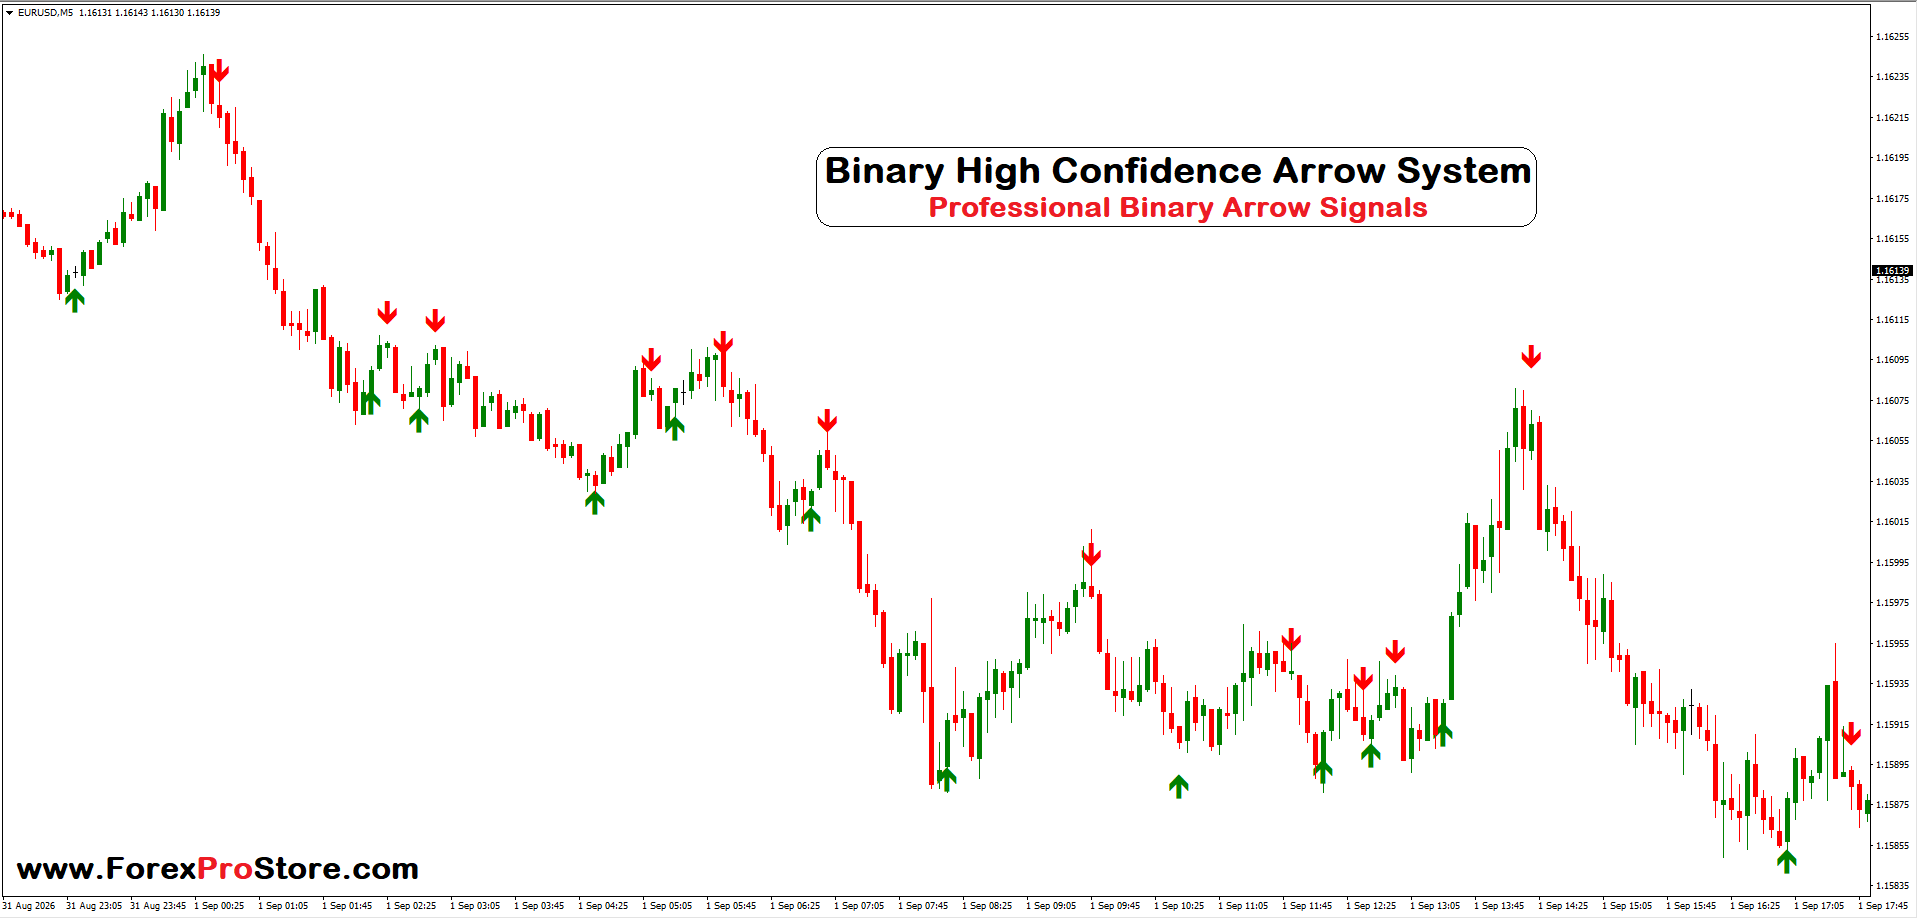
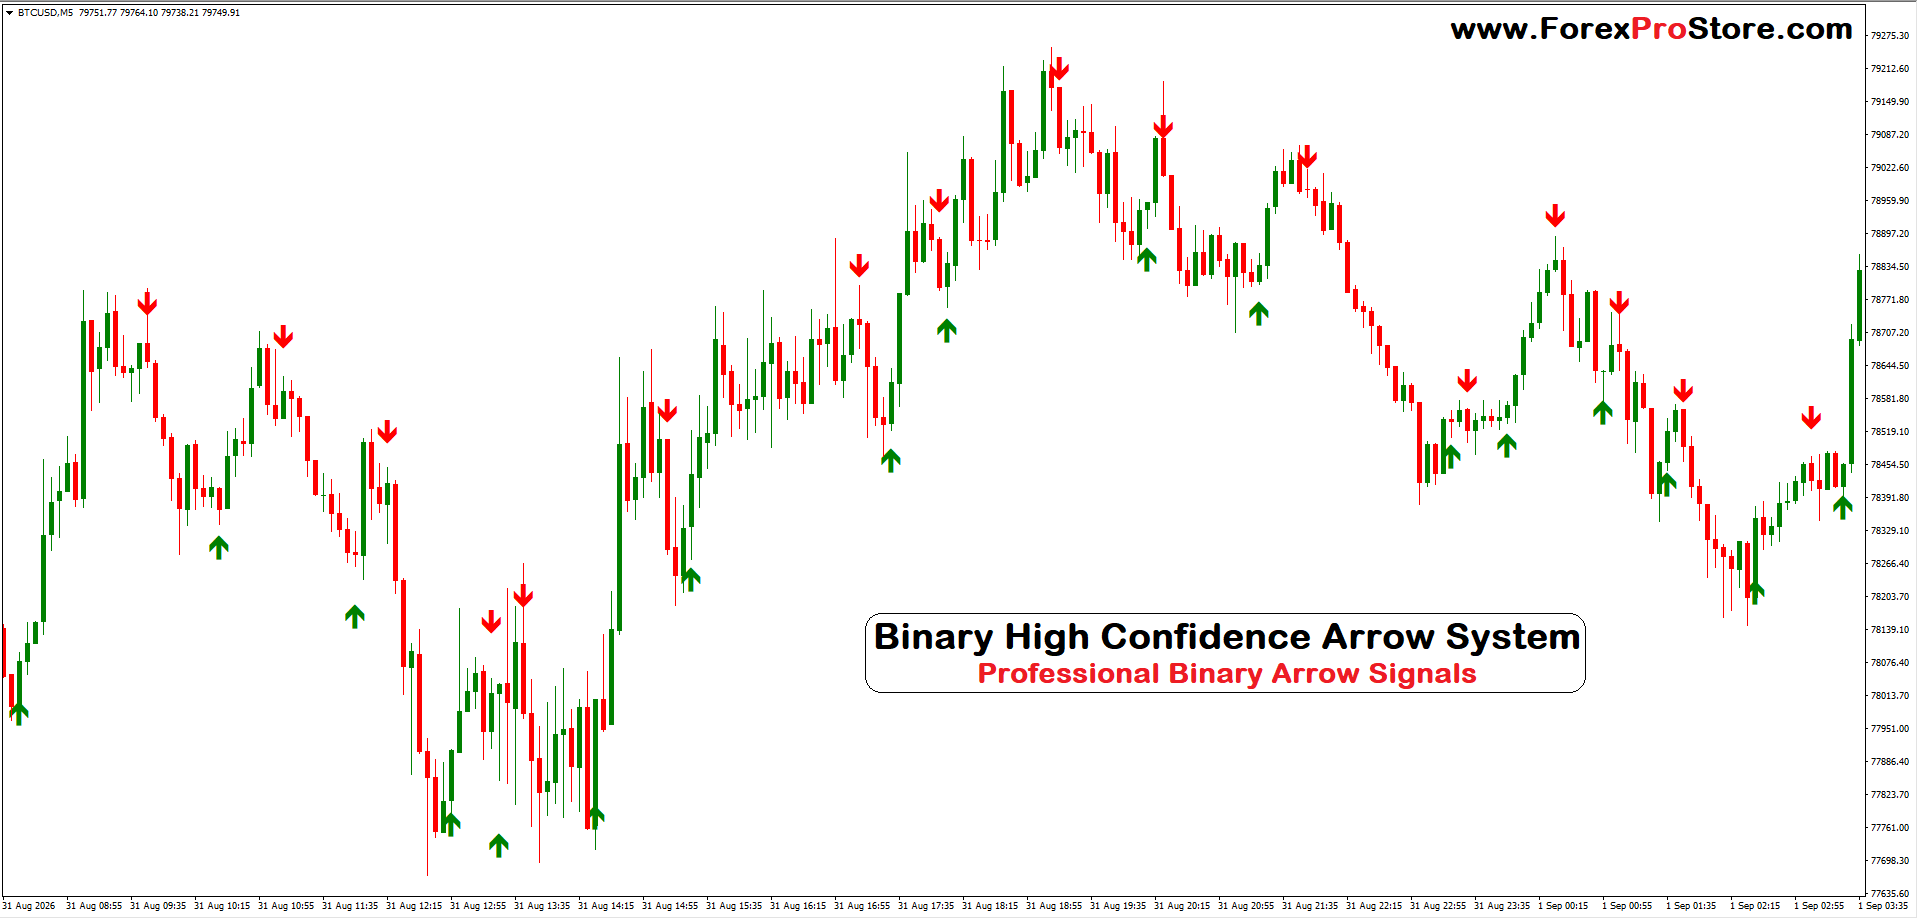
There are two main signals visible in your screenshot:
🟢 Green Up Arrow – Possible CALL
A green upward arrow appears below the candles.
It generally means the indicator is suggesting that the market may move upward.
For a binary-options trader, this would normally be considered a possible:
CALL / UP trade
For example:
- A green arrow appears below a candle.
- The candle closes.
- You check whether price is showing bullish momentum.
- If the setup is acceptable, you consider a CALL with your chosen expiry.
However, don’t enter simply because you see a green arrow. Confirmation is important.
🔴 Red Down Arrow – Possible PUT
A red downward arrow appears above the candles.
It generally indicates a possible downward movement.
For binary options, this would normally correspond to:
PUT / DOWN trade
For example:
- A red arrow appears above the candle.
- Wait for the signal candle to close.
- Check whether sellers are actually controlling the market.
- If the setup agrees with the signal, consider a PUT.
2. How to Use It on the M1 Chart
The screenshot shows XAUUSD M1, meaning each candle represents approximately one minute.
A basic workflow can be:
Step 1 – Open Your Chart
Open your preferred trading platform and select:
XAUUSD → M1
You can also experiment with other assets and timeframes, but don’t assume that settings that work on Gold M1 will automatically work on other markets.
Step 2 – Add the Indicator
Attach the Binary High Confidence Arrow System to your chart.
Make sure the arrows are clearly visible above and below the candles.
Step 3 – Wait for a Signal
Don’t continuously predict where price will go.
Instead, wait for a new arrow.
- Green arrow → possible bullish setup
- Red arrow → possible bearish setup
Step 4 – Wait for Candle Confirmation
This is particularly important on M1.
A candle that is still forming can change significantly before it closes. Therefore, it is safer to evaluate the signal after the signal candle has closed, especially if you are trying to avoid acting on an unstable signal.
Step 5 – Check the Market Direction
Look at the candles surrounding the arrow.
For a green signal, you ideally want to see:
- Bullish candles
- Higher highs or higher lows
- Strong upward movement
- Price moving away from an important support area
For a red signal, you ideally want:
- Bearish candles
- Lower highs or lower lows
- Strong downward movement
- Price moving away from resistance
This filtering process can help eliminate some weaker signals.
3. Don’t Trade Every Arrow
One of the biggest mistakes beginners make is taking every signal.
For example, imagine you receive:
🟢 CALL
🔴 PUT
🟢 CALL
🔴 PUT
within a short period.
This may indicate that the market is moving sideways or is highly volatile.
In such conditions, arrow signals can become less reliable because price doesn’t have a clear direction.
A better approach is to wait for a signal that agrees with the broader market structure.
4. Use Support and Resistance
Another useful confirmation technique is support and resistance.
Suppose Gold falls toward a strong support level and a green arrow appears.
You now have two pieces of information:
Support + Green Arrow = potentially stronger bullish setup
Similarly, if Gold reaches resistance and a red arrow appears:
Resistance + Red Arrow = potentially stronger bearish setup
5. Choosing an Expiry Time
Binary options use an expiry period, so timing is extremely important.
On an M1 chart, traders may consider short expiries, but extremely short expiries can be particularly sensitive to spread, volatility, execution delay, and random price fluctuations.
Instead of blindly using one expiry for every signal, test the indicator historically and in a demo environment to determine whether its signals have any statistical advantage.
For example, you could compare:
- 1-minute expiry
- 2-minute expiry
- 3-minute expiry
- 5-minute expiry
Then record the results.
Don’t choose an expiry simply because a particular signal looks good on the chart.
6. Major Benefits of the Indicator
1. Easy to Understand
The biggest advantage is simplicity.
You don’t need to study multiple complicated indicators just to understand the basic signal.
Green = possible UP
Red = possible DOWN
2. Quick Market Reading
M1 trading moves very quickly.
Arrows can make it easier to notice potential turning points without manually scanning every candle.
3. Useful for Scalping Analysis
Because the screenshot demonstrates the system on XAUUSD M1, it can be useful for traders who specifically study short-term market movements.
However, Gold can move very quickly, so M1 trading requires discipline.
4. Helps Reduce Emotional Decisions
Instead of entering trades randomly because you feel that price “should” go up or down, you can create a predefined rule:
Wait → Signal → Confirmation → Trade only if conditions are acceptable.
This can help improve consistency in decision-making.
5. Can Be Combined With Other Tools
The arrow should not necessarily be your only source of information.
You can combine it with:
- Support and resistance
- Trend direction
- Candlestick patterns
- Moving averages
- RSI
- Price action
- Market volatility
The purpose is to filter weak signals, rather than blindly increasing the number of trades.
7. Example of a Better CALL Setup
Imagine Gold is moving upward.
Price pulls back toward a support zone.
Then a green arrow appears below a candle.
The candle closes bullish and the next candle continues upward.
This creates a logical sequence:
Uptrend → Pullback → Support → Green Arrow → Bullish Confirmation
This is generally a more structured setup than simply seeing a green arrow in the middle of a random sideways market.
8. Example of a Better PUT Setup
Imagine Gold is trending downward.
Price makes a temporary upward retracement toward resistance.
A red arrow appears above the candle.
The candle closes bearish and selling pressure continues.
The setup becomes:
Downtrend → Retracement → Resistance → Red Arrow → Bearish Confirmation
Final Conclusion
The Binary High Confidence Arrow System is best understood as a visual signal and market-filtering tool. The green arrows can highlight potential bullish opportunities, while the red arrows can highlight potential bearish opportunities.
For M1 Gold trading, a sensible approach is:
Wait for Arrow → Wait for Candle Close → Check Trend → Check Support/Resistance → Confirm Price Action → Take Only Selective Trades.
Its main benefits are simplicity, fast visual signals, easier chart reading, and the ability to create a structured trading routine.
Related products
Binary Indicators
Binary Indicators
Binary Indicators
Binary Indicators
Binary Indicators
Binary Indicators
Binary Indicators
Binary Indicators