
100% Profit Binary M1 Arrow Indicator
Original price was: $2,000.00.$400.00Current price is: $400.00.
⭐ Binary Options Indicator Features
✅ Original & Reliable Binary Indicator
🎯 CALL & PUT Entry Signals
⚡ Fast & Clear Arrow Signals
⏱️ Multiple Timeframes Supported
📈 Suitable for Short-Term Trading
💻 Works on Mobile, Tablet & PC
🌍 Works with Forex, Crypto & Stock Assets
🔄 Easy-to-Use Trading Signals
📊 Expiry-Based Binary Options Strategy
🛠️ Customer Support & Free Updates
💎 One-Time Payment • Lifetime Use
How to Use the Binary Option M1 Arrow Indicator
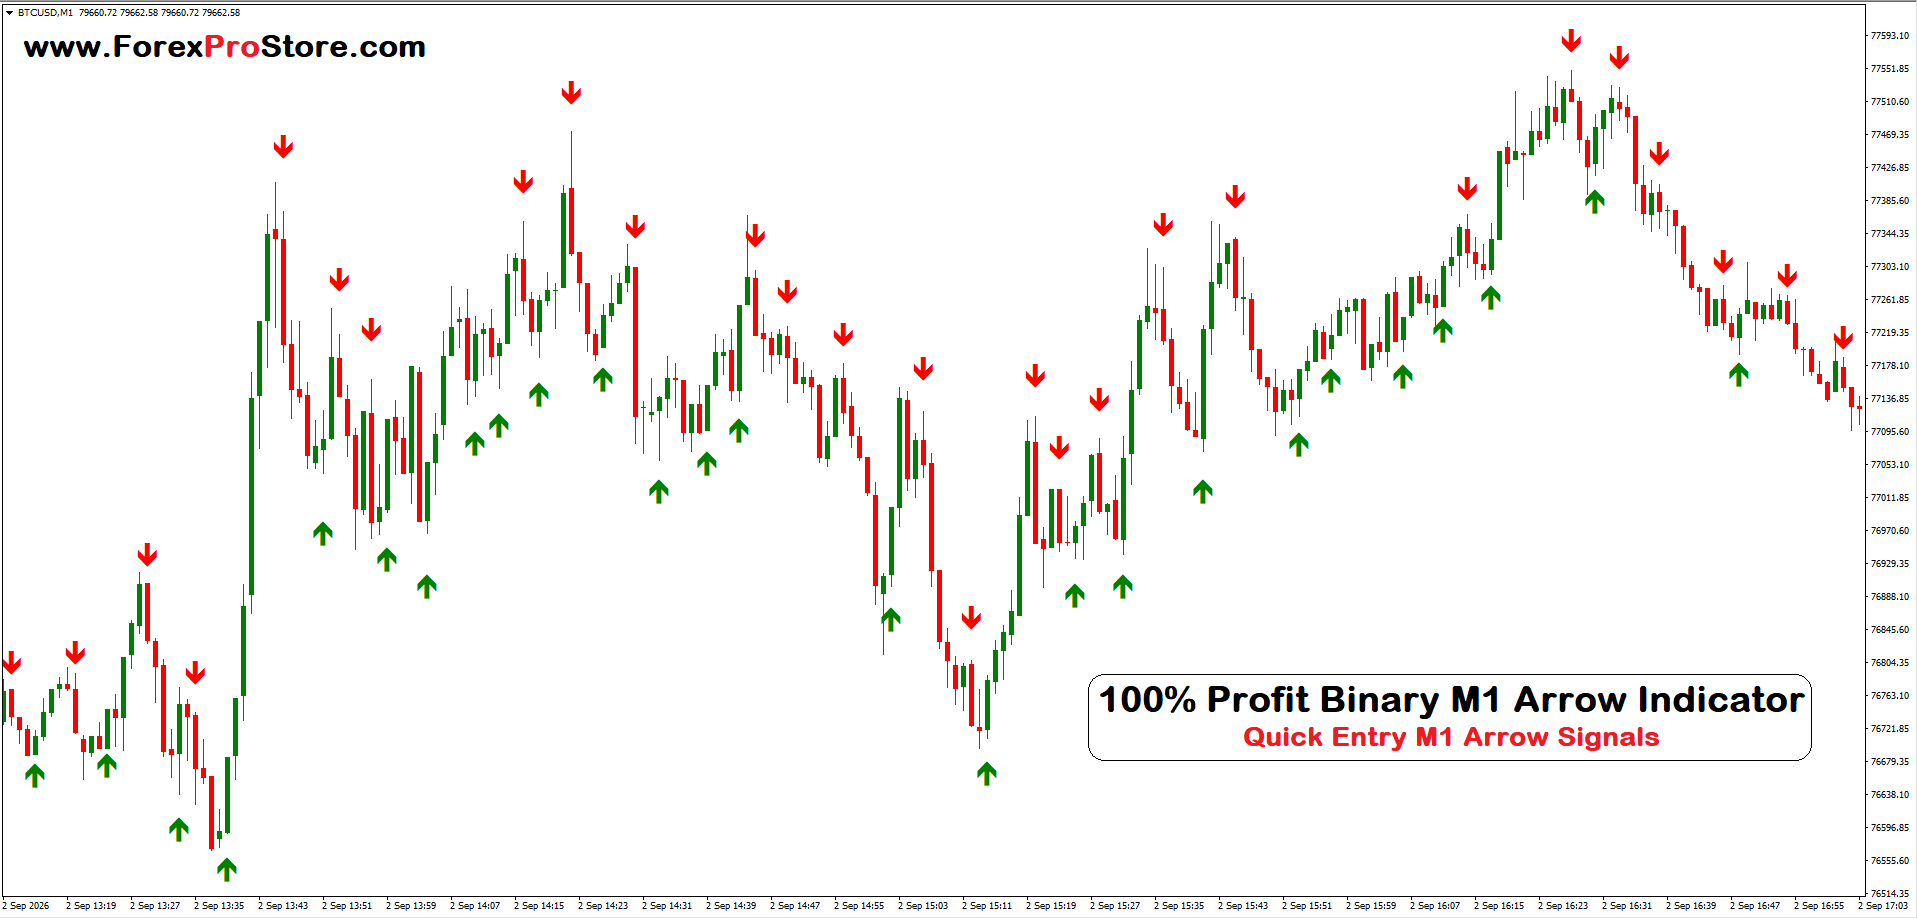
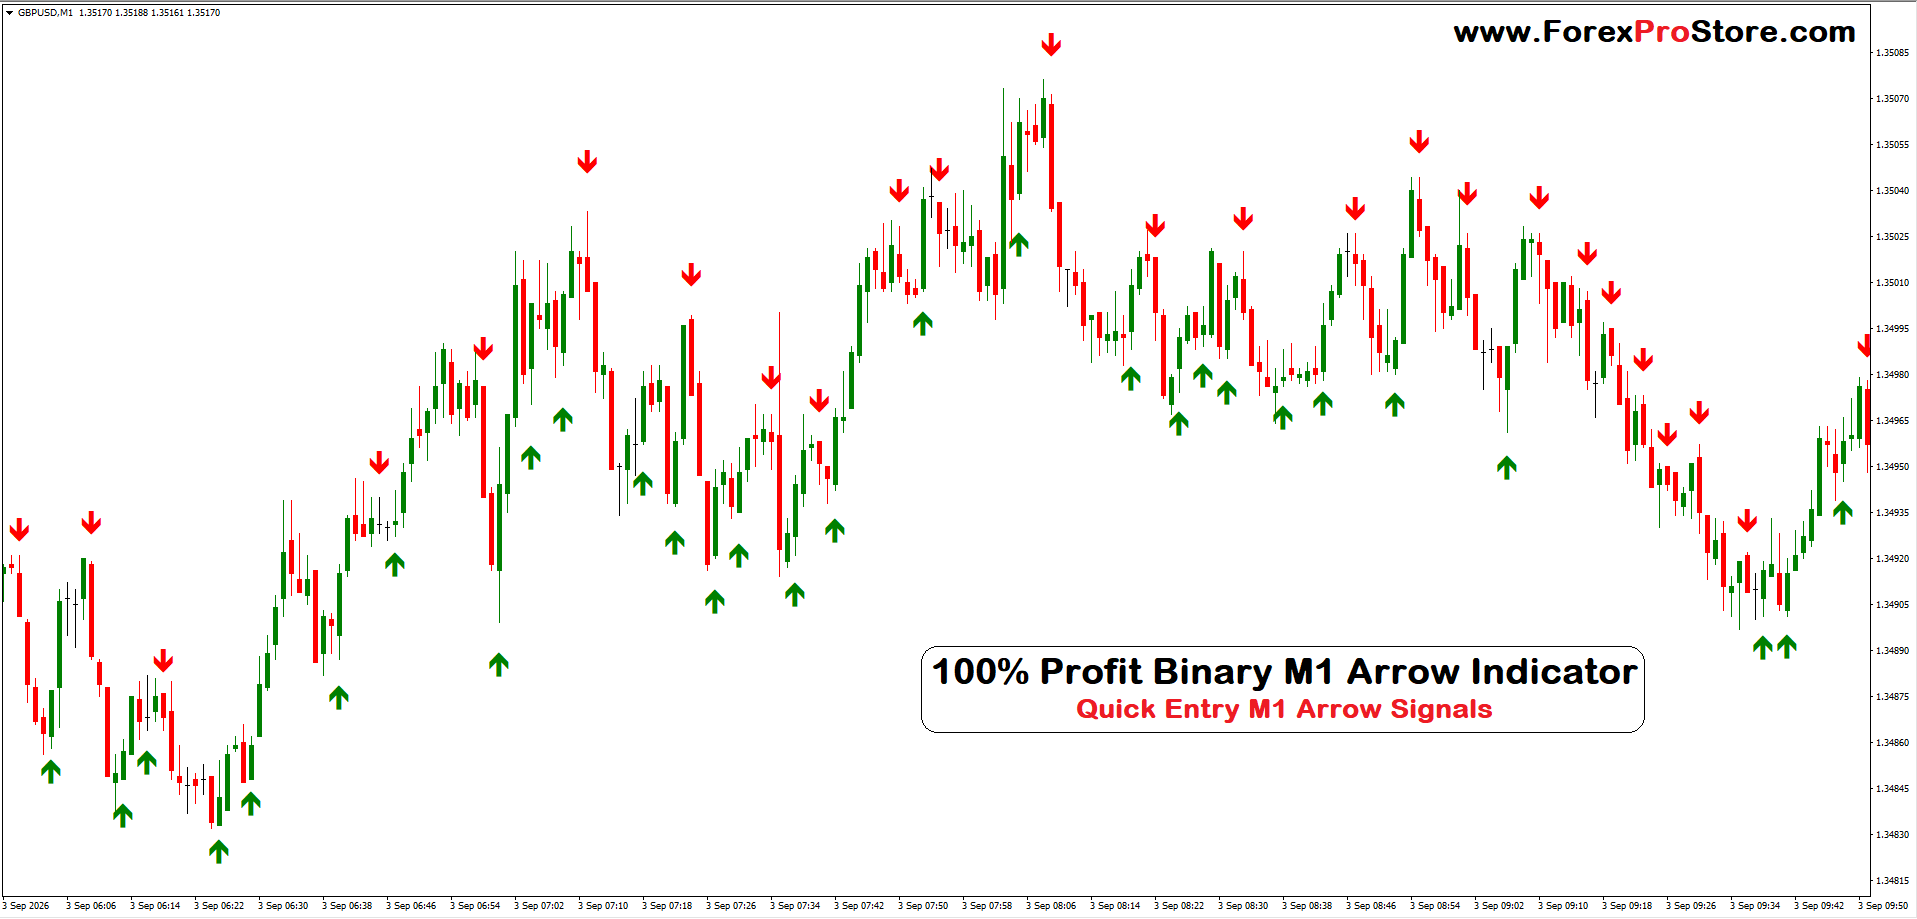
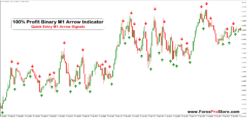
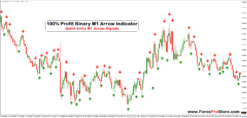
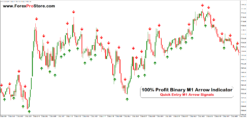
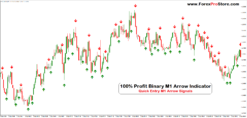
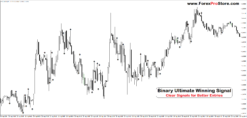
The indicator shown in your chart is an arrow-based Buy/Sell signal indicator. It displays green upward arrows for possible CALL/UP opportunities and red downward arrows for possible PUT/DOWN opportunities. The main purpose is to make short-term trading decisions easier by showing potential entry points directly on the candlestick chart.
1) How to Use It
🟢 Green Arrow — CALL / UP
When a green upward arrow appears below a candle, it indicates that the indicator is detecting a possible upward move.
A simple method is:
- Wait for the candle to close where the green arrow appears.
- Check whether the next candle starts moving upward.
- If the overall short-term trend also supports the signal, consider a CALL/UP trade.
- Avoid entering while the signal candle is still forming.
🔴 Red Arrow — PUT / DOWN
A red downward arrow above a candle indicates a possible downward move.
The basic process is:
- Wait for the signal candle to close.
- Confirm that price is beginning to move downward.
- Look at the recent candles to see whether the market direction agrees with the arrow.
- Consider a PUT/DOWN trade only after confirmation.
The most important rule is not to blindly trade every arrow. Markets can move sideways, reverse suddenly, or produce false signals.
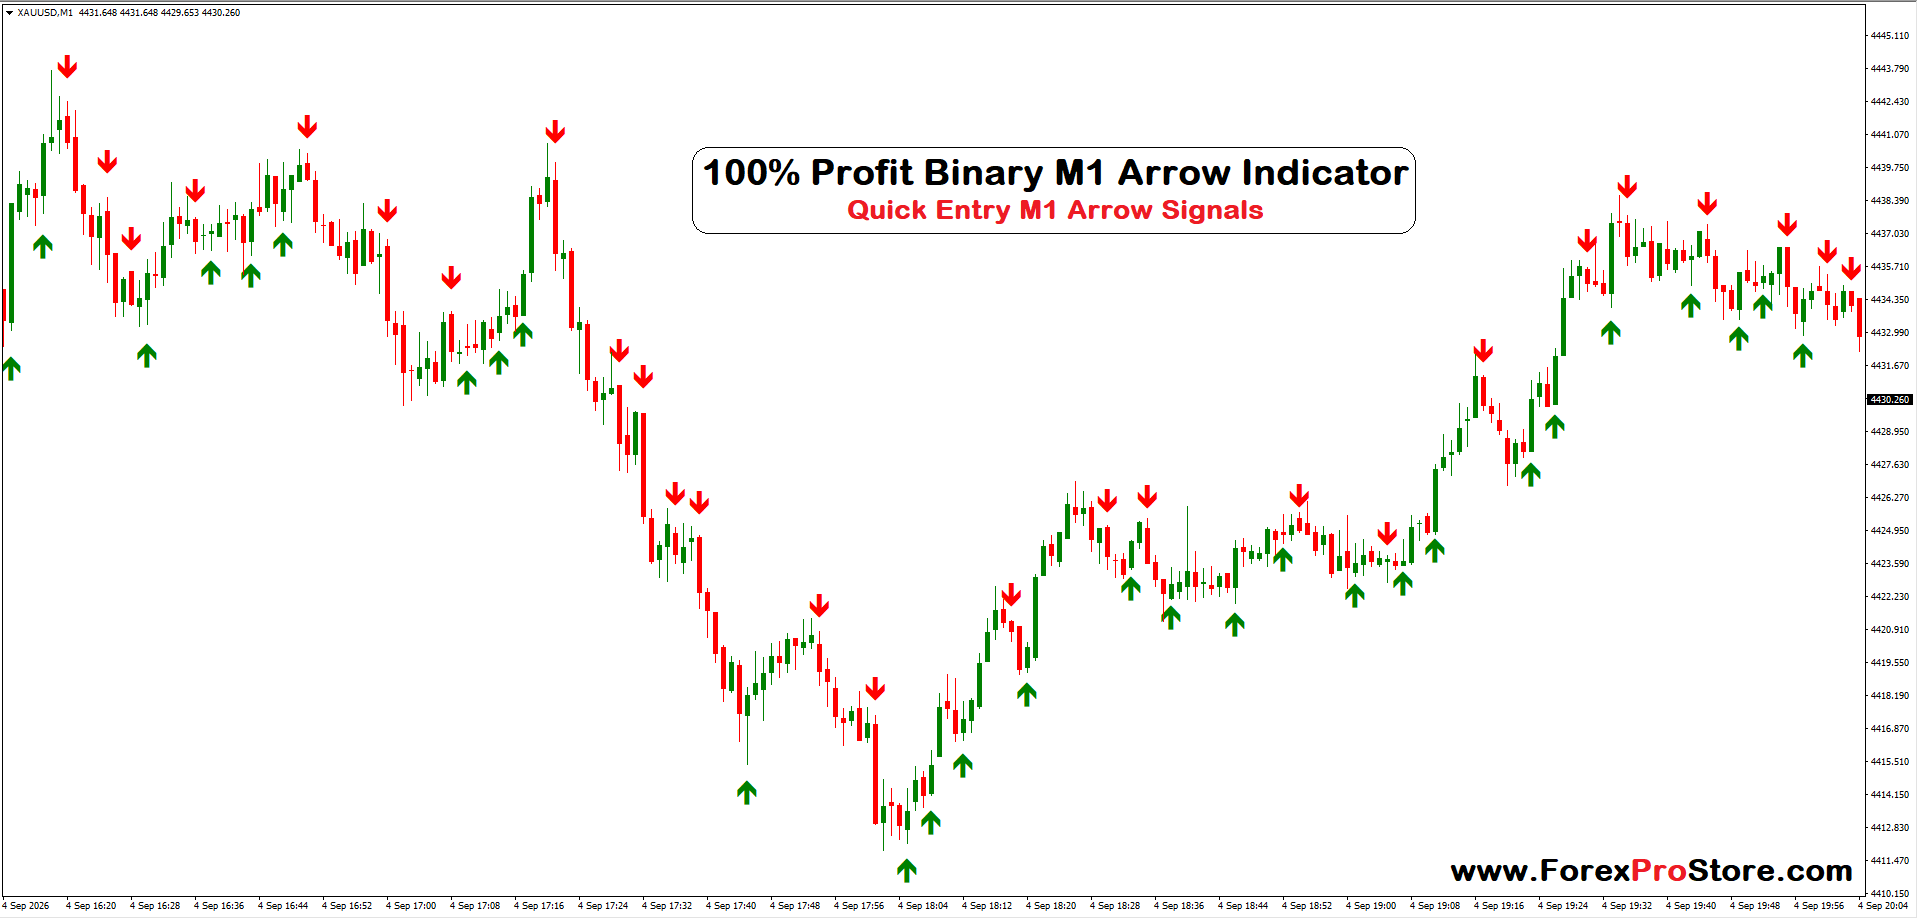
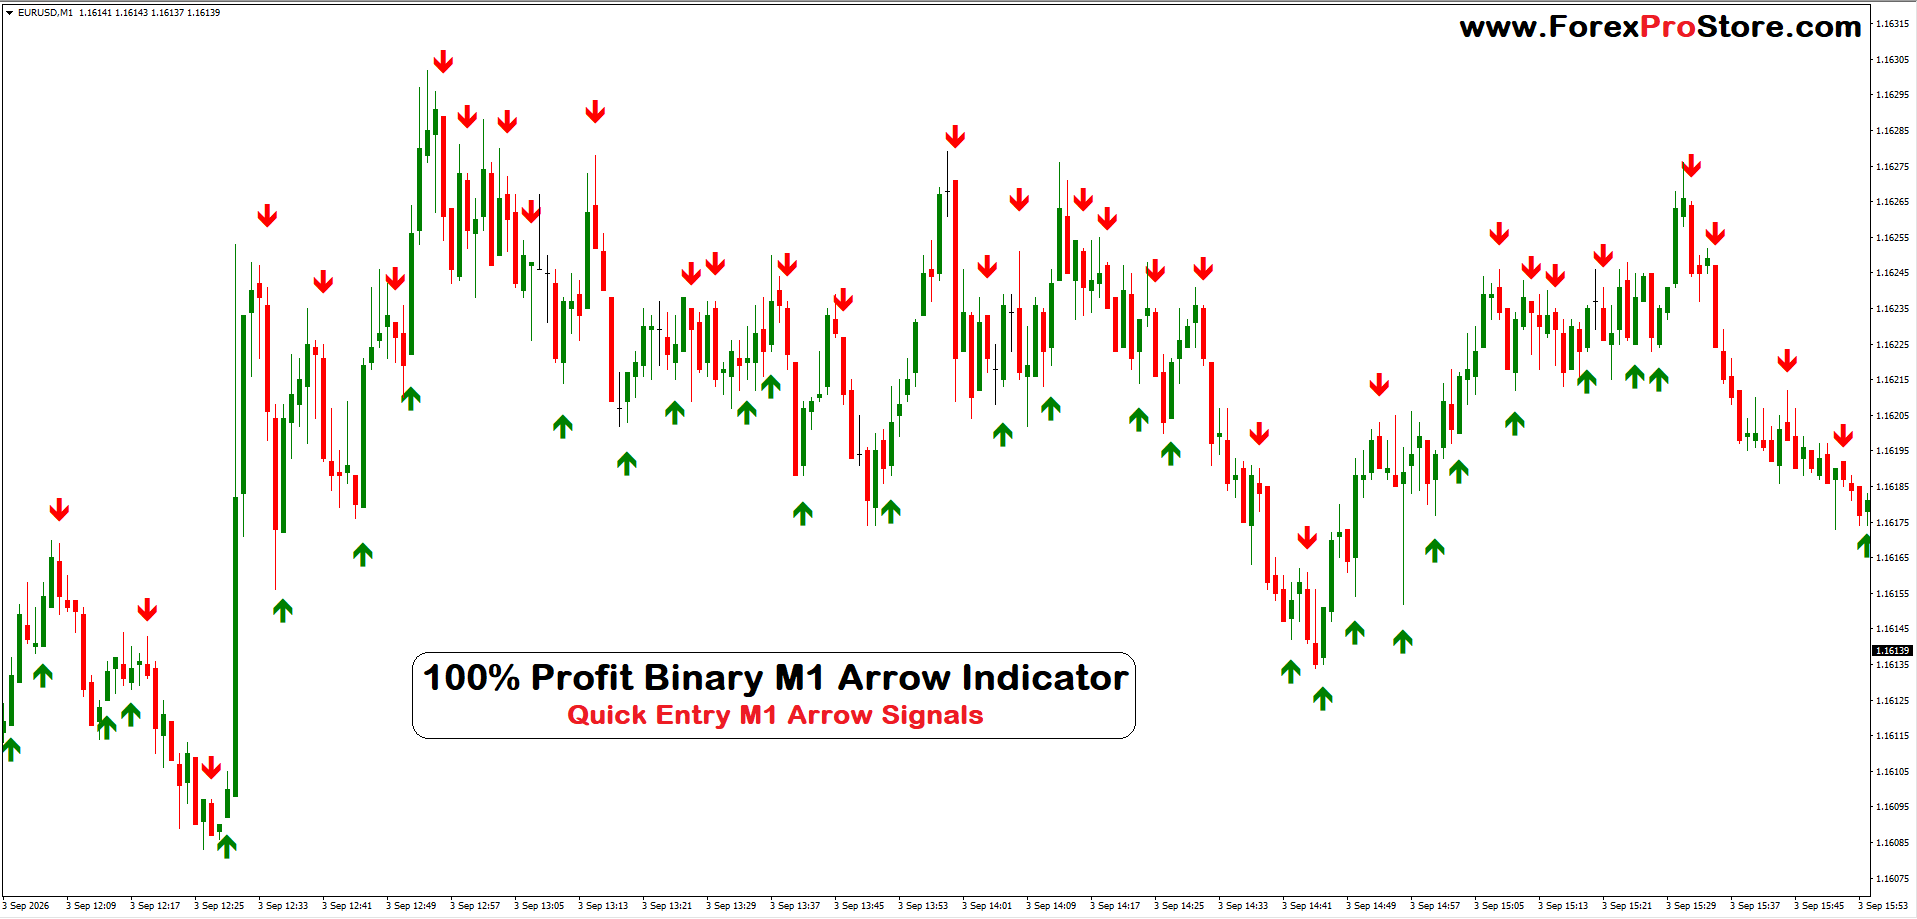
2) Some M1 Charts Screenshots:-
The M1 timeframe means each candle represents 1 minute. It is commonly used for very short-term trading.
On an M1 chart, the arrows can appear frequently because the market is constantly producing new candles.
M1 Example 1 — Green Arrow
Imagine GBPUSD is moving downward for several candles. Price then slows down and a green arrow appears below a candle.
Instead of immediately entering, wait for the candle to close. If the following candle moves upward and the recent price action supports the reversal, this can be considered a possible CALL setup.
M1 Example 2 — Red Arrow
Suppose price has moved upward for several candles and then a red arrow appears above the candle. If the next candle starts falling, it may provide a possible PUT setup.
M1 trading is fast, so confirmation is particularly important.
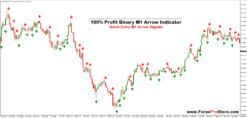
M1 Example 3 — Avoid Sideways Signals
If green and red arrows are appearing very close together while candles are moving sideways, it is better to be cautious. This type of market can produce multiple losing signals.
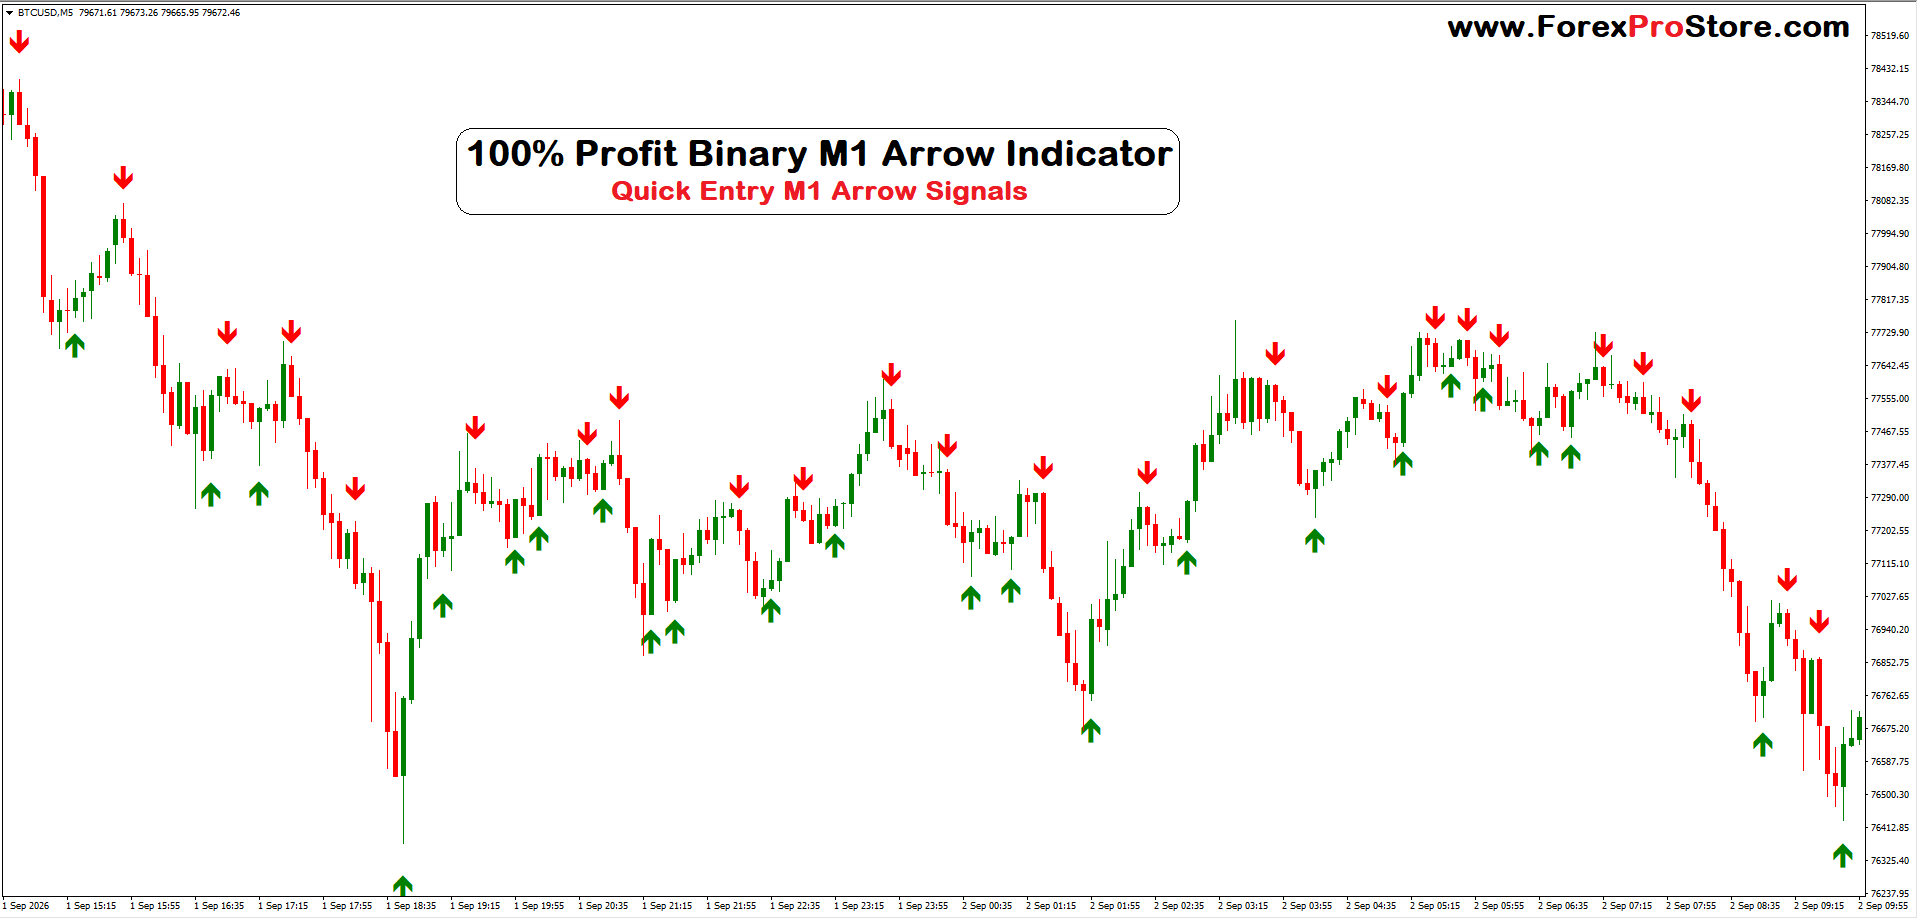
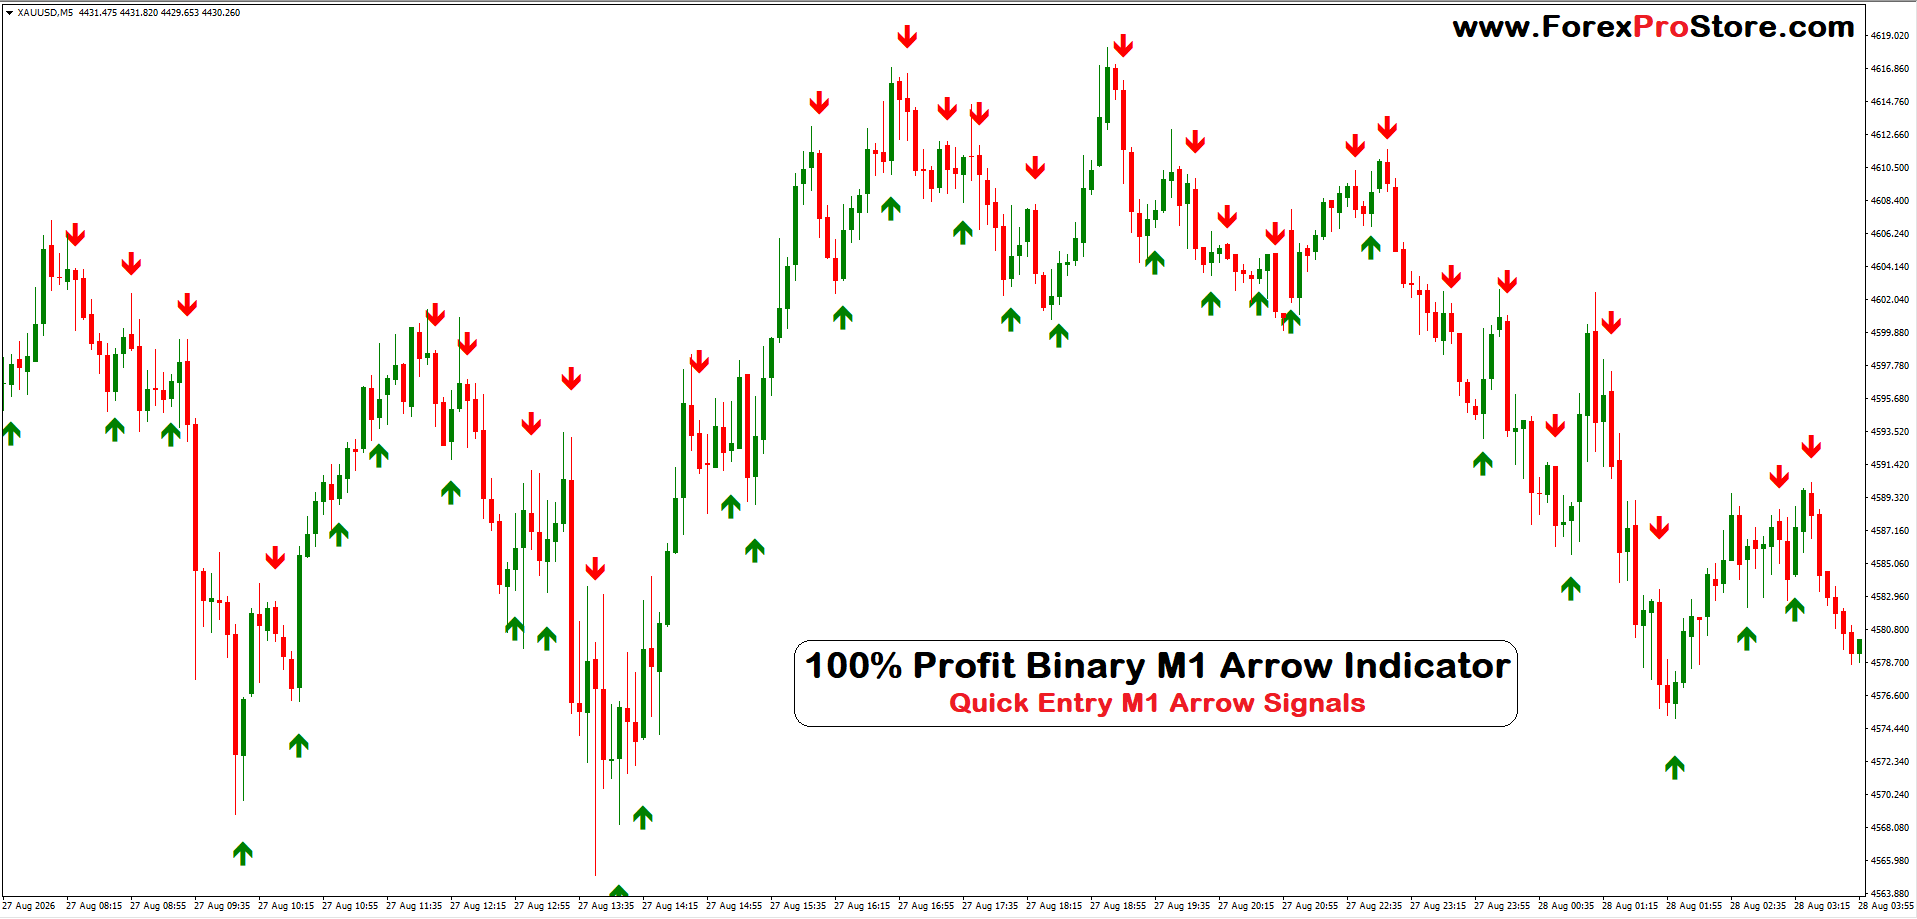
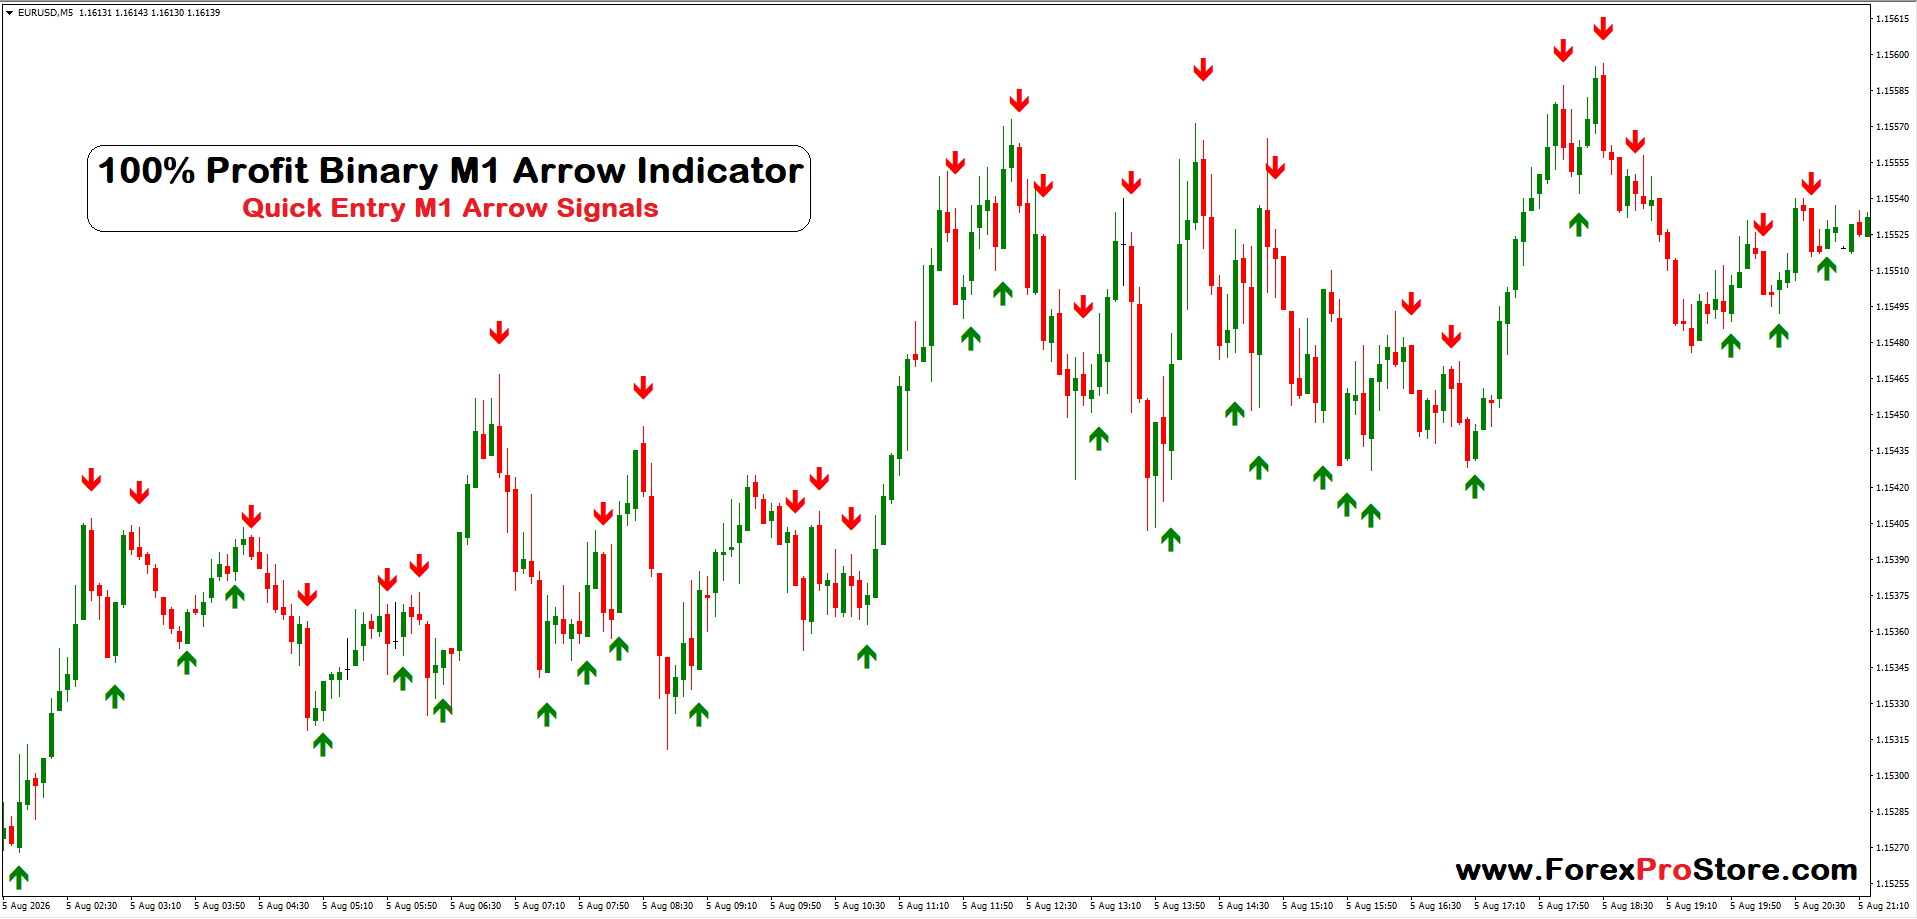
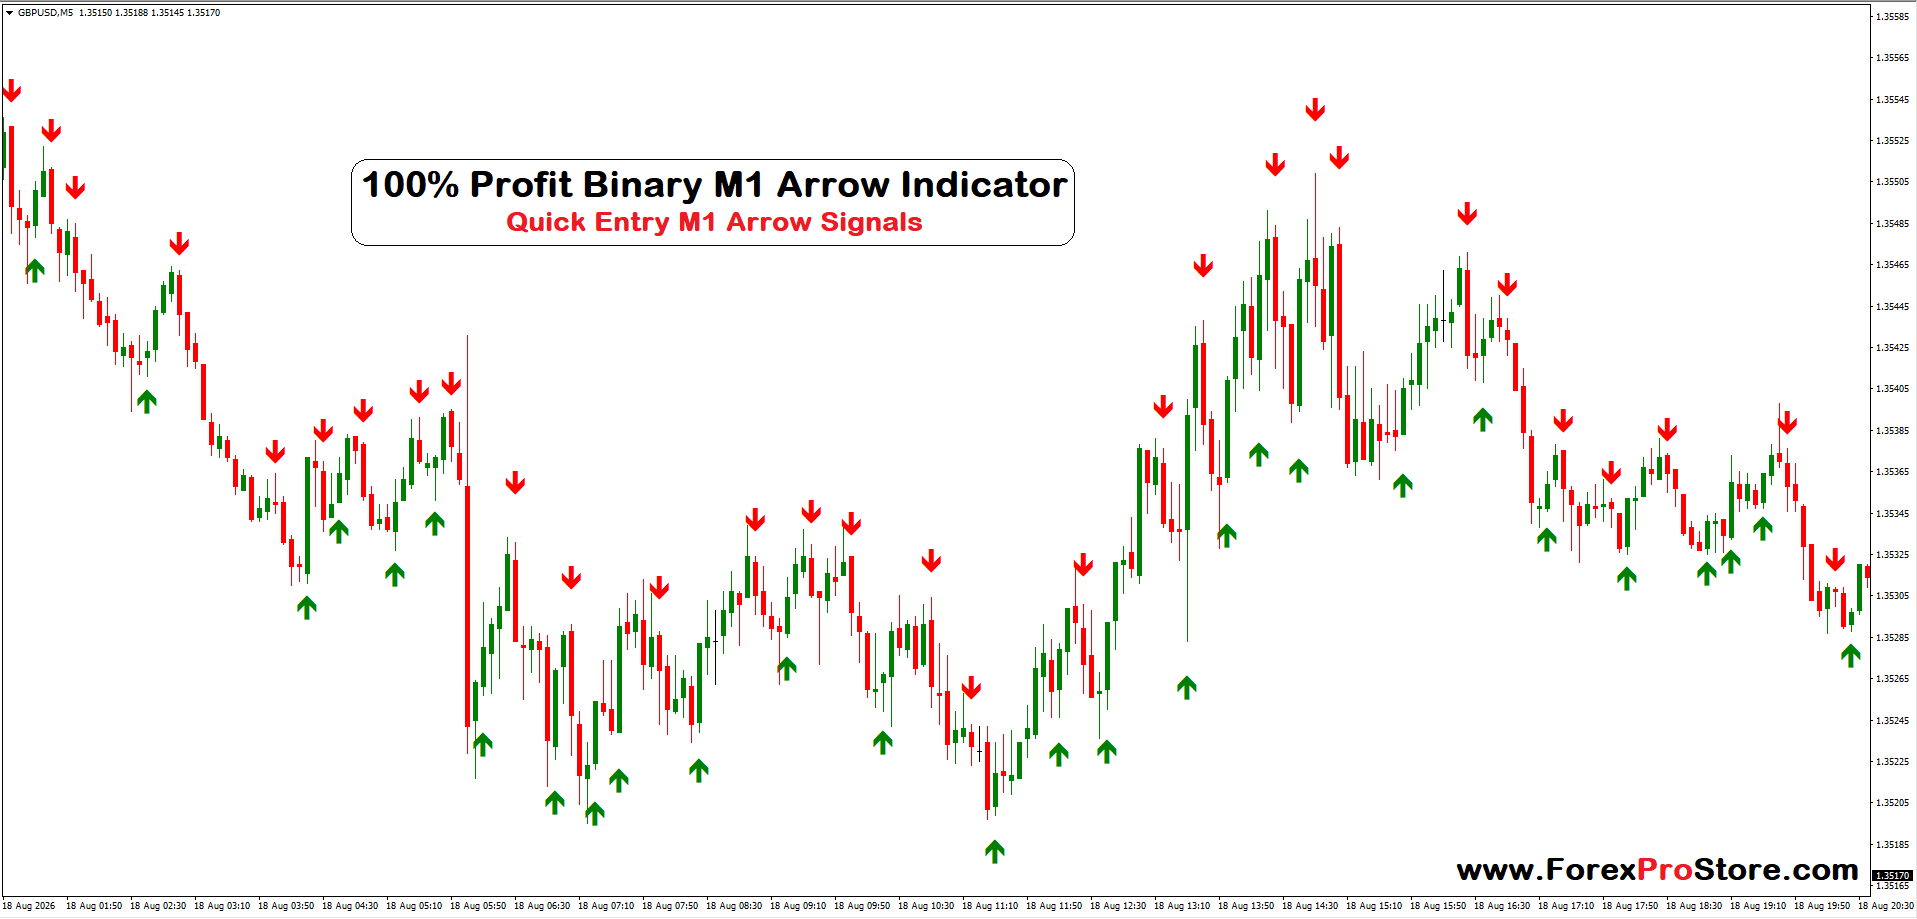
3) Some M5 Charts Screenshots:-
The M5 timeframe means each candle represents 5 minutes. Compared with M1, M5 generally gives you a slower view of price movement and can help filter some market noise.
M5 Example 1 — Downtrend
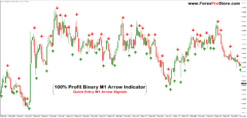
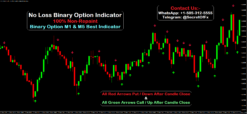
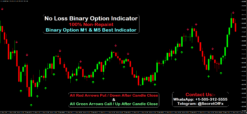
In the screenshot, there are areas where several red arrows appear during downward price movements. When an arrow agrees with the existing trend, it can provide a more structured setup than taking an isolated reversal signal.
M5 Example 2 — Uptrend
On the right-middle portion of the chart, price makes a strong upward movement and several green arrows appear underneath candles. When price is making higher highs and higher lows, a green arrow that agrees with that direction can be treated as a possible bullish confirmation.
M5 Example 3 — Reversal
When price reaches an important recent high or low and an opposite arrow appears, traders may watch for a reversal. However, the safer approach is to wait for candle confirmation rather than entering immediately.
Main Benefits
1. Easy to understand: Green = possible UP, red = possible DOWN.
2. Fast decision-making: Arrows are placed directly on the chart.
3. Useful for short-term trading: M1 can be used for quick setups, while M5 can provide a broader view.
4. Helps identify market direction: Multiple arrows moving with the same trend can make the current direction easier to see.
5. Can be combined with other tools: You can confirm signals using support/resistance, moving averages, RSI, or price action.
6. Suitable for backtesting: You can review historical candles and record how signals performed under your chosen entry and expiry rules.
Best Practical Approach
A simple method is M5 for trend confirmation + M1 for entry timing. For example, if M5 shows an overall bullish structure, wait for a green M1 arrow and bullish confirmation before considering a CALL. If M5 is bearish, look for a red M1 arrow for a possible PUT.
Related products
Binary Indicators
Binary Indicators
Binary Indicators
Binary Indicators
Binary Indicators
Binary Indicators
Binary Indicators
Binary Indicators