Moving Average King Indicator 100% non Repaint
$399.00 Original price was: $399.00.$80.00Current price is: $80.00.
Moving Average King Indicator 100% non Repaint
Hello dear Traders,
This is our best Forex Trading Indicator.
100% Non repaint Indicator and accuracy 85-90%+
This is the world’s best Indicator for Long term.
It’s name“Moving Average King Indicator”
This indicator very easy to use for beginner And fully automatically.
It will never expire and there are NO “monthly fees”
or NO any other recurring charges for use
File type and requirements:-
This is a digital item!(Download links–zip file)
You will Need: MT4 terminal
This files you’ll get is ZIP archive.
Indicator installation Service is Free :- If you don’t know how to install the indicator. Contact me I will install mt4 Indicator in your Pc/Laptop with TeamViewer software
HOW TO USE:-
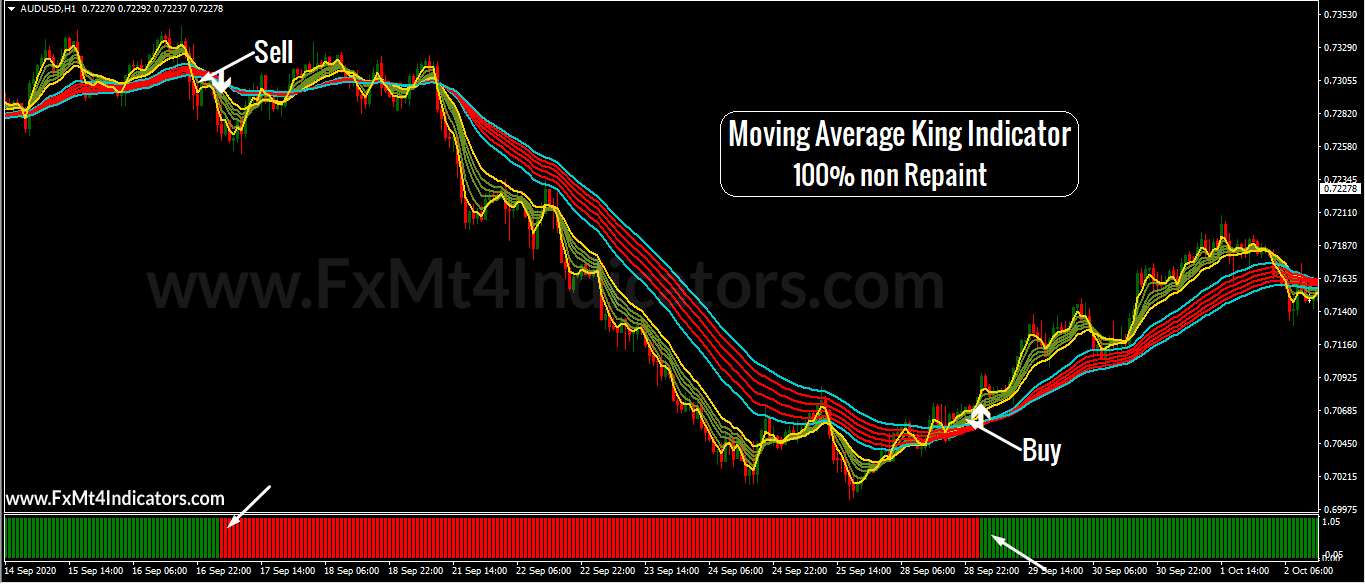
FOR SELL ENTRY:-
-
1. First made White Arrow on the top.
-
2. Second made Completely crossed Green zone moving averages to Red zone moving averages.
-
3. Third made same time Bottom Indicator give Red Sell signal.
-
4. Three confirmation after take Instant Sell entry.
FOR BUY ENTRY:-
-
1. First made White Arrow on the bottom.
-
2. Second made Completely crossed Red zone moving averages to Green zone moving averages.
-
3. Third made same time Bottom Indicator give Green Buy signal.
-
4. Three confirmation after take Instant Buy entry.
Moving Average King Indicator 100% non Repaint Key Takeaways. A moving average (MA) is a widely used technical indicator that smooths out price trends by filtering out the “noise” from random short-term price fluctuations. Moving averages can be constructed in several different ways, and employ different numbers of days for the averaging interval.
Why Use a Moving Average
A moving average helps cut down the amount of “noise” on a price chart. Look at the direction of the moving average to get a basic idea of which way the price is moving. If it is angled up, the price is moving up (or was recently) overall; angled down, and the price is moving down overall; moving sideways, and the price is likely in a range.
A moving average can also act as support or resistance. In an uptrend, a 50-day, 100-day or 200-day moving average may act as a support level, as shown in the figure below. This is because the average acts like a floor (support), so the price bounces up off of it. In a downtrend, a moving average may act as resistance; like a ceiling, the price hits the level and then starts to drop again.
Types of Moving Averages
A moving average can be calculated in different ways. A five-day simple moving average (SMA) adds up the five most recent daily closing prices and divides it by five to create a new average each day. Each average is connected to the next, creating the singular flowing line.
Trading Strategies—Crossovers
Crossovers are one of the main moving average strategies. The first type is a price crossover, which is when the price crosses above or below a moving average to signal a potential change in trend.
Another strategy is to apply two moving averages to a chart: one longer and one shorter. When the shorter-term MA crosses above the longer-term MA, it’s a buy signal, as it indicates that the trend is shifting up. This is known as a “golden cross.”
Meanwhile, when the shorter-term MA crosses below the longer-term MA, it’s a sell signal, as it indicates that the trend is shifting down. This is known as a “dead/death cross.”
Related products
Indicators
Indicators
Indicators
Indicators
Indicators
Indicators
Indicators
Indicators


