


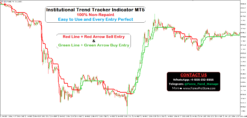
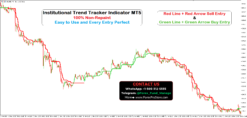
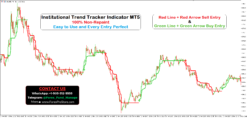
Institutional Trend Tracker Indicator MT5
Original price was: $1,500.00.$280.00Current price is: $280.00.
- Original Indicator
- 100% Non-Repaint
- Trading time: Every time
- Instant Download in Zip file
- Arrows Popup Sound Alerts
- Recommend Timeframe: M1, M5, M15, M30, H1
- Use on unlimited MT5 accounts
- Type of strategy: Scalping and Long-Term
- Never repaint any trading signal, 100% guaranteed
- Built for Metatrader 5 (MT5 for PC and Laptop, MT4 for MAC)
- Works on Forex (all pairs), Commodities, Stocks, Metals, Gold…
- Recommended Broker: ICMARKET EXNESS
- Pay Once and Use for Lifetime
- Customer Support & Free Upgrades For Life Time
How to Use Institutional Trend Tracker Indicator MT5 – Complete Guide for Beginners
The Institutional Trend Tracker Indicator MT5 is a simple trading tool designed to help traders identify market trends and potential Buy and Sell opportunities. It makes chart analysis easier by displaying coloured lines and arrows directly on the trading chart.
This indicator is useful for beginners as well as experienced traders who want to understand market direction without using too many complicated technical indicators.
Let’s understand how to use it step by step.
1. Understanding the Indicator Signals
The Institutional Trend Tracker Indicator uses two main colours to show the market direction.
↓
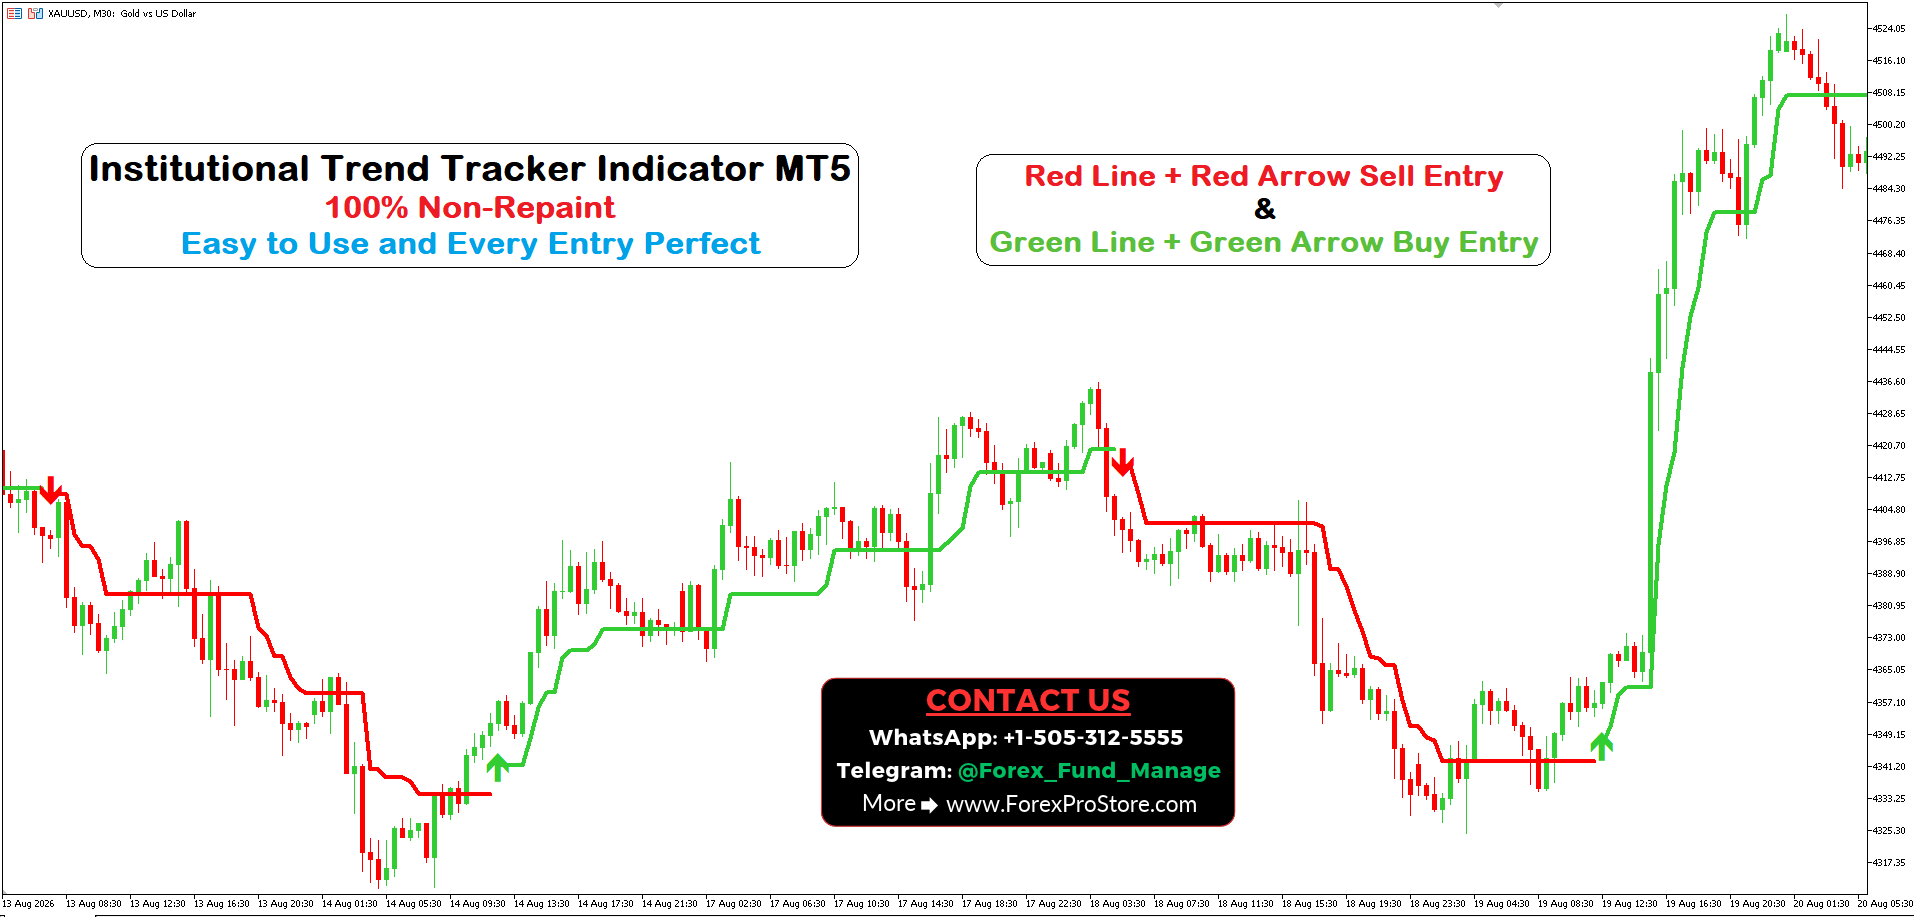
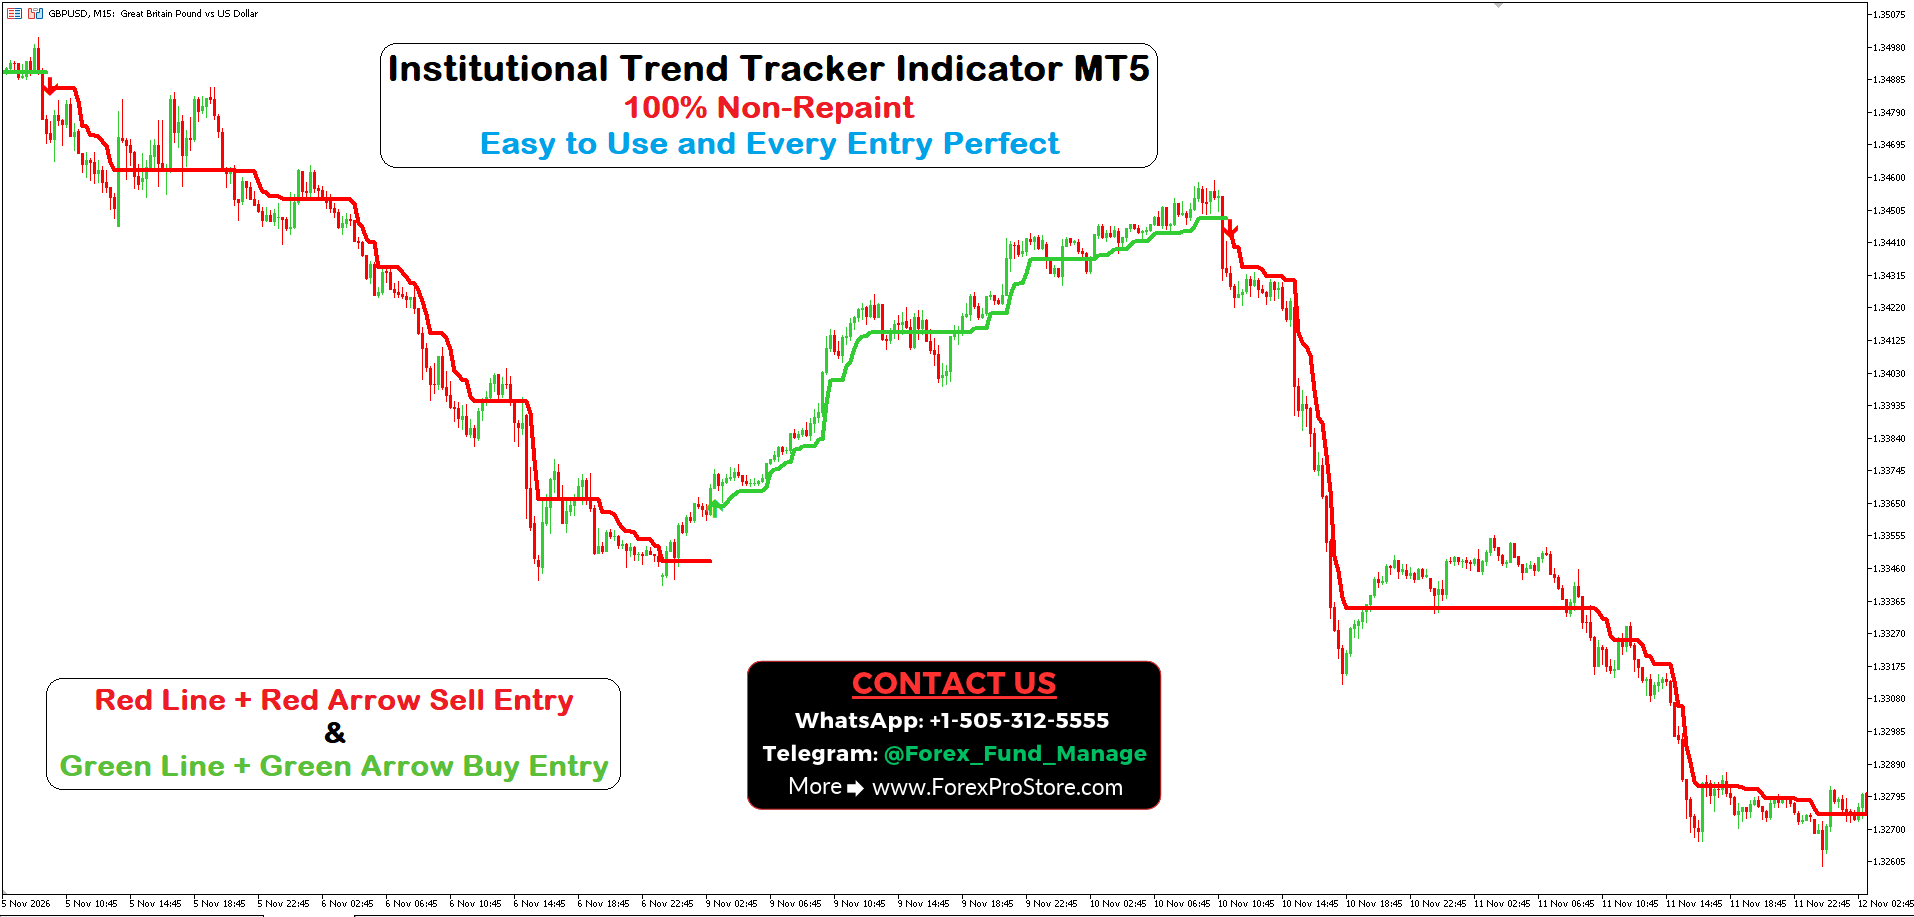
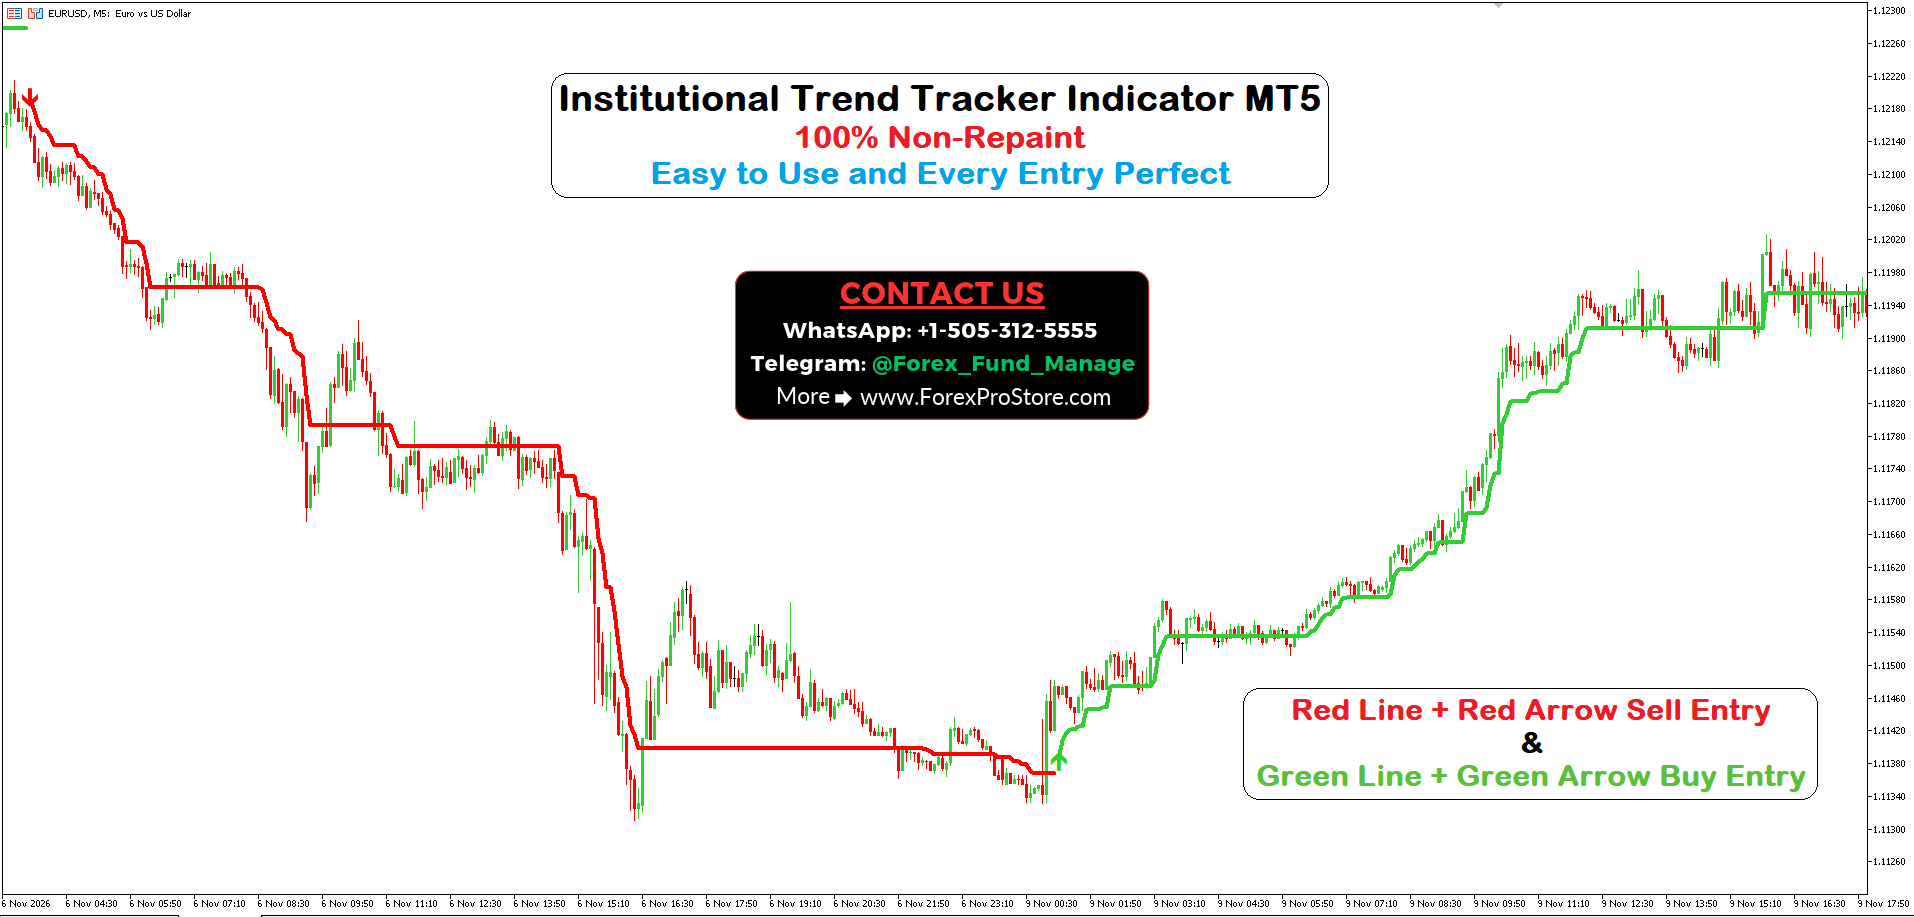
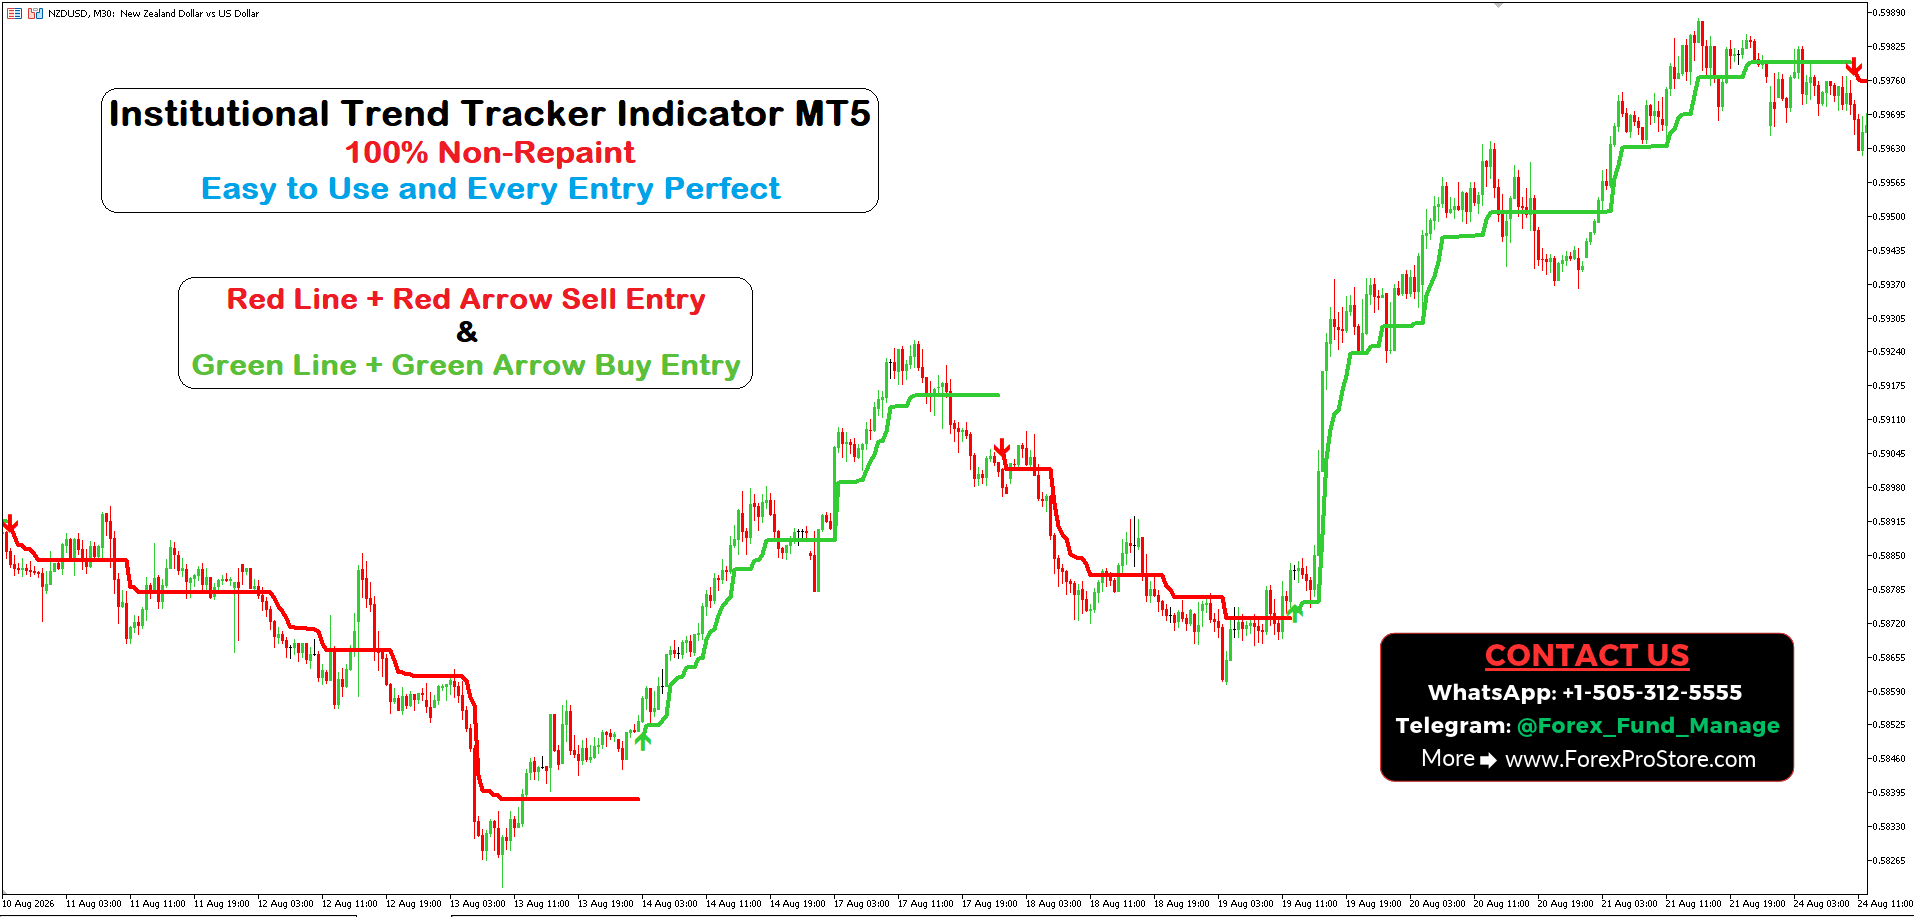
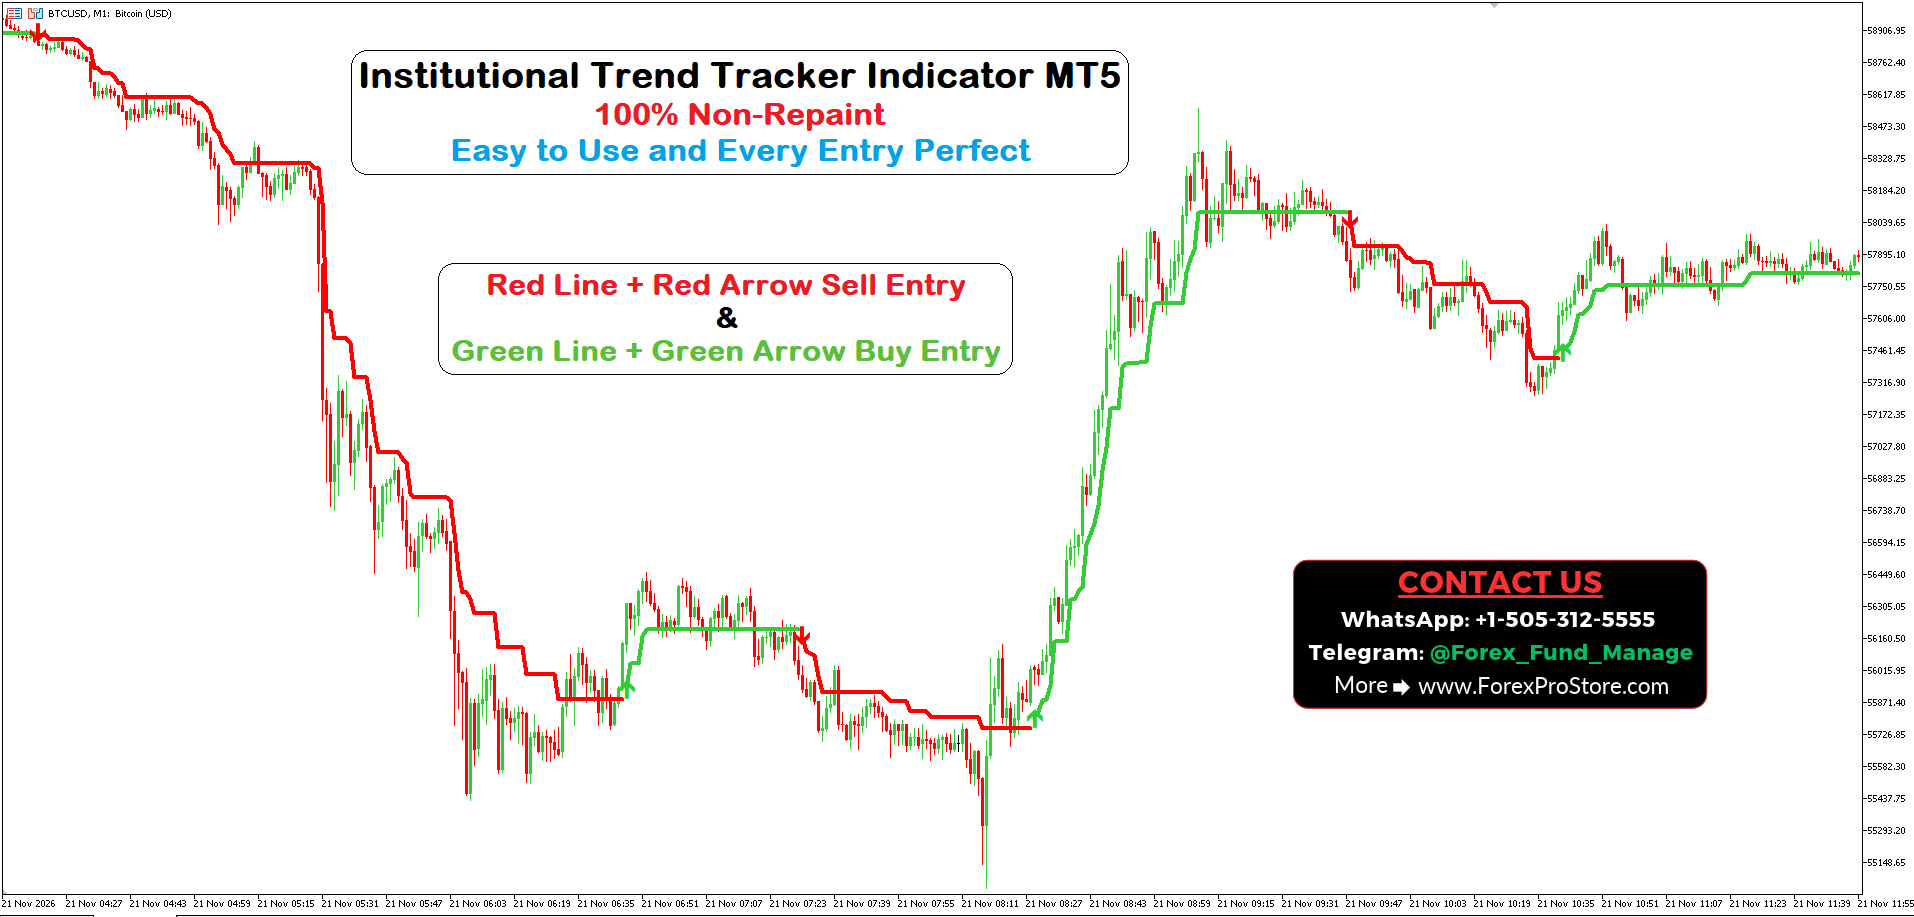
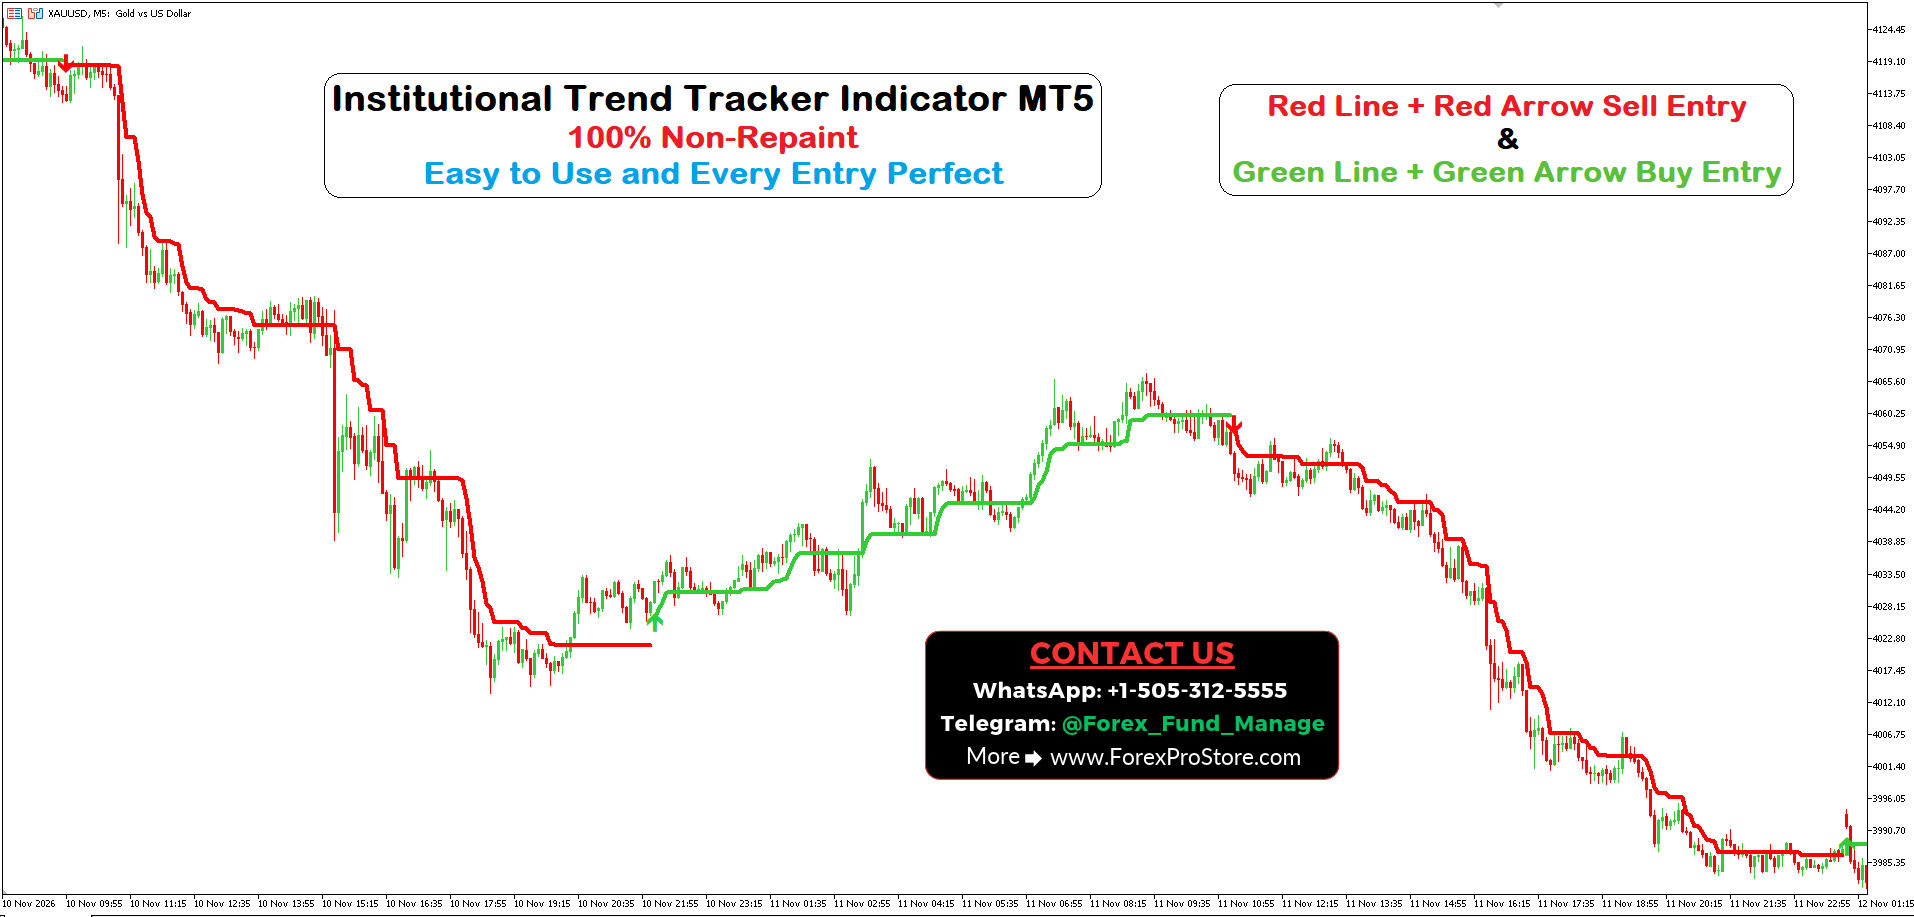
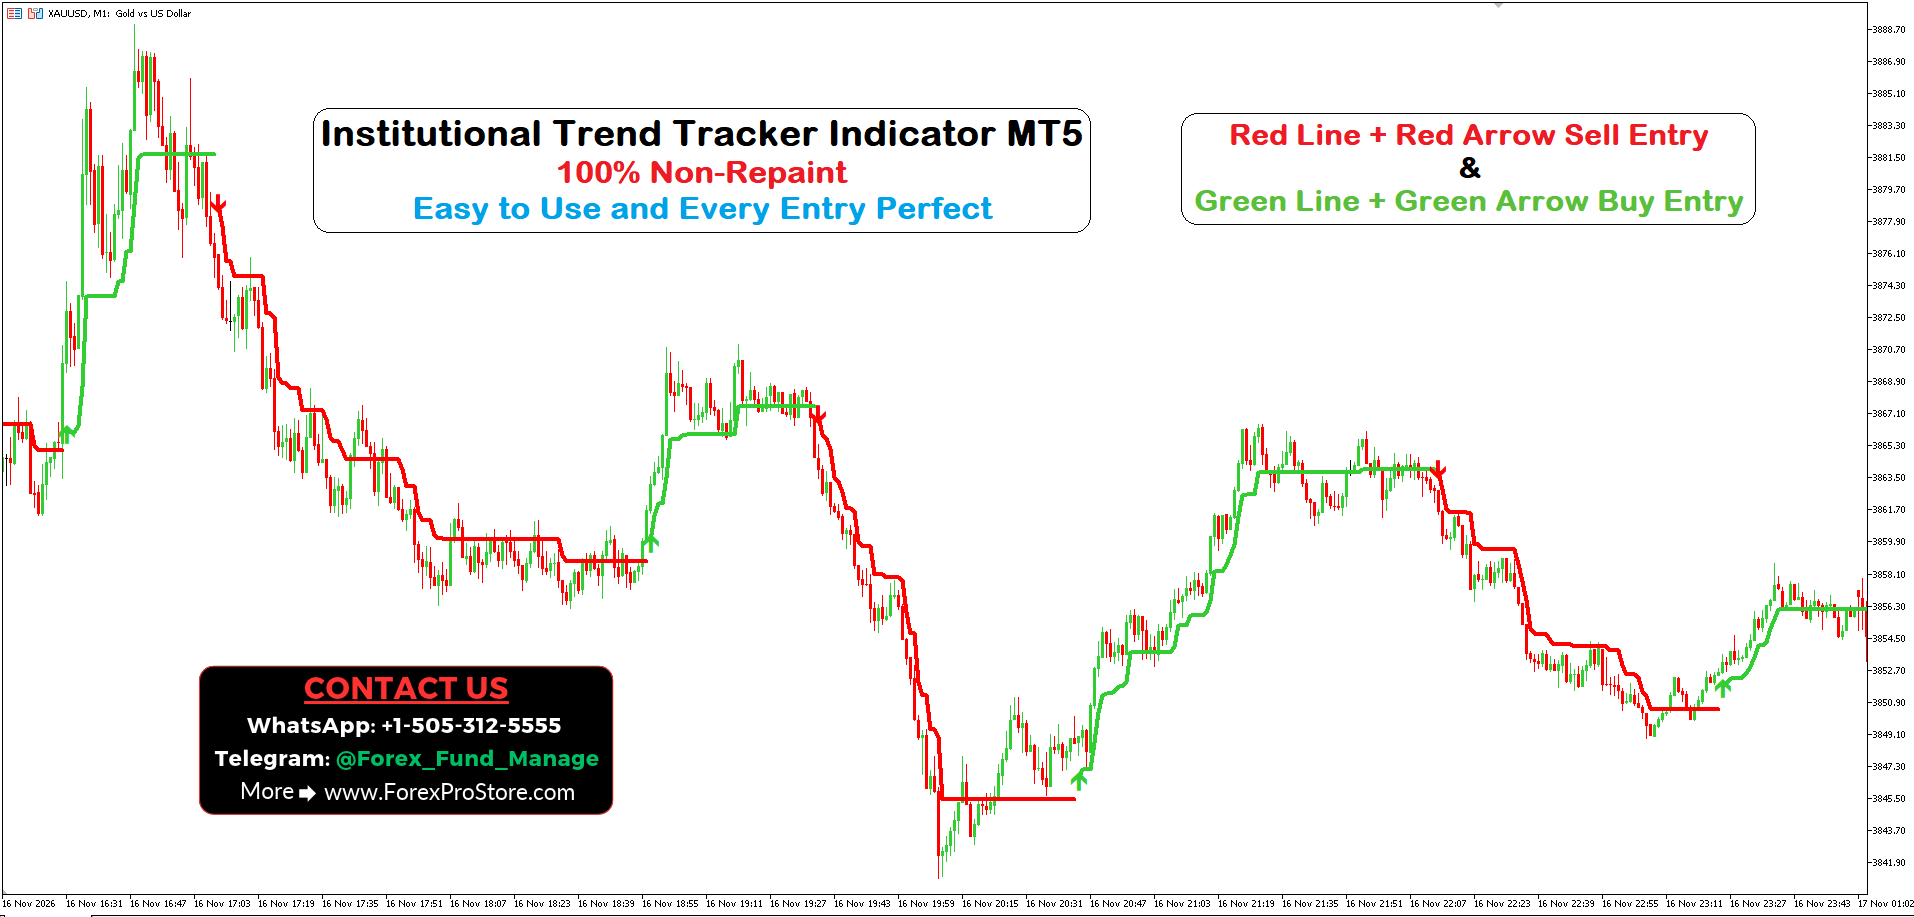
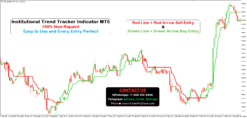
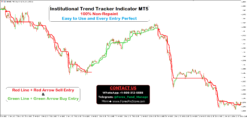
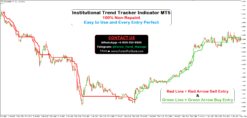
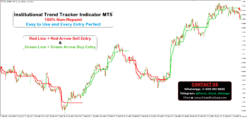
Red Line + Red Arrow = SELL Signal
When the indicator displays a red line and a red downward arrow, it indicates possible selling pressure. It suggests that the market may be moving downward.
↑
Green Line + Green Arrow = BUY Signal
When the indicator displays a green line and a green upward arrow, it indicates possible buying pressure. It suggests that the market may be moving upward.
2. How to Take a BUY Trade
Follow these simple steps to identify a potential Buy entry:
-
Open your preferred currency pair, such as GBPUSD, EURUSD, or XAUUSD.
-
Wait for the indicator to display a green line.
-
Look for a green upward arrow as a potential Buy confirmation.
-
Wait for the current candle to close before making a trading decision.
-
Consider opening a Buy trade after the signal is confirmed.
-
Place your Stop Loss below the recent swing low.
-
Set your Take Profit according to your risk-to-reward ratio.
Example: If GBPUSD is moving upward and the indicator shows a green line with a green arrow, it may indicate a potential buying opportunity.
3. How to Take a SELL Trade
Follow these steps to identify a potential Sell entry:
-
Open your preferred trading chart.
-
Wait for the indicator to display a red line.
-
Look for a red downward arrow as a potential Sell confirmation.
-
Wait for the candle to close.
-
Consider opening a Sell trade after confirmation.
-
Place your Stop Loss above the recent swing high.
-
Set your Take Profit based on your trading strategy.
Example: If GBPUSD is moving downward and the indicator displays a red line with a red arrow, it may indicate a potential selling opportunity.
4. Understanding the Indicator Lines
The coloured lines help traders understand the current market direction.
-
Green Line: Indicates a bullish market direction and possible buying opportunities.
-
Red Line: Indicates a bearish market direction and possible selling opportunities.
When the green line appears and continues moving upward, it suggests that buyers may be controlling the market.
When the red line appears and continues moving downward, it suggests that sellers may be controlling the market.
These lines can also help traders understand when the market direction changes.
5. Which Timeframe Should You Use?
You can test the indicator on different timeframes depending on your trading style.
| Timeframe | Trading Style |
|---|---|
| M1 | Very short-term trading |
| M5 | Scalping |
| M15 | Intraday trading |
| M30 | Short-term trading |
| H1 | Trend trading |
| H4 | Longer-term trend analysis |
Beginners can start with the M15 or M30 timeframe because these charts generally provide more time to analyse signals.
The screenshot provided shows the indicator on a GBPUSD M15 chart.
6. Important Trading Tips
To use the Institutional Trend Tracker Indicator more effectively, follow these important tips:
-
Avoid entering trades before the candle closes.
-
Do not open trades based only on one signal.
-
Avoid trading during extremely low market volatility.
-
Always use a Stop Loss to protect your trading capital.
-
Check the overall market trend before entering a trade.
-
Avoid taking Buy and Sell trades repeatedly during sideways markets.
-
Practise on a demo account before using real money.
7. Final Conclusion
The Institutional Trend Tracker Indicator MT5 is designed to make trend identification easier through simple red and green lines and directional arrows. The green signal helps identify potential Buy opportunities, while the red signal helps identify potential Sell opportunities.
Its simple visual approach can help beginners understand market direction without complicated chart analysis. For better results, combine its signals with price action, proper Stop Loss placement, and good money management.
Related products

MT5 Indicators
MT5 Indicators
MT5 Indicators
MT5 Indicators